
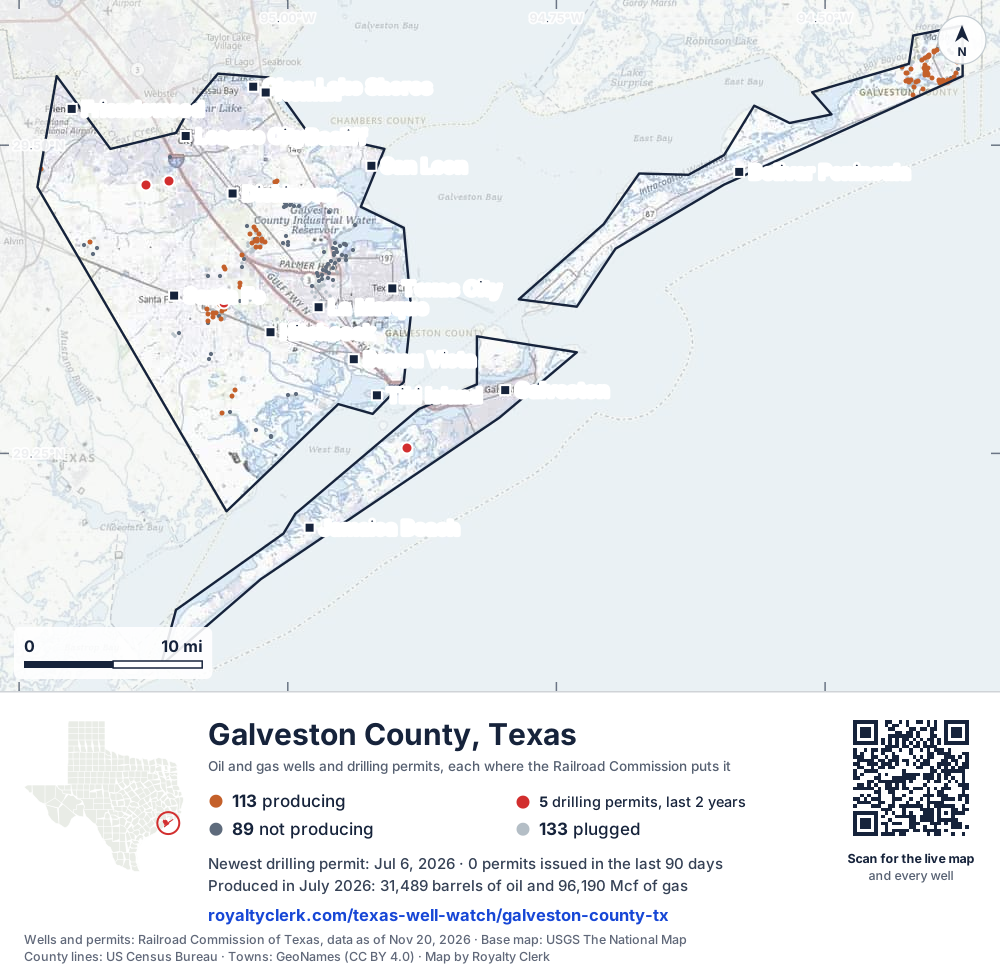
Texas countyRailroad Commission district 03Through July 2026
Galveston CountyTexas oil and gas
Galveston County sold 431,795 barrels of oil and 1.56 billion cubic feet of gas in the last 12 months. Oil passed gas here in 2025.
August 2026 is still coming in. About 89% of Texas leases have reported it so far, so this page counts through July 2026 until it is fully reported.
- Oil, last 12 months
- 431,795 bbl
- Gas, last 12 months
- 1.56 billion cu ft
- Producing leases
- 46 of 115
- Wells on the map
- 335
- Drilling locations, two years
- 5
- Operators
- 12
- Top field
- High Island
The story, from 403 months of reports
How Galveston County turned to oil in 2024
- 1Gas county JANUARY 1993
- 2Oil passes gas MAY 2015
- 3Gas passes oil FEBRUARY 2022
- 4Oil passes gas JULY 2025
Galveston County turned to oil in 2024, after years in which gas made more of its output. Oil has made more than gas in every full calendar year since, and oil in the last 12 months is about a tenth of 1999, its biggest full calendar year for oil: 11.3%.
XTO Energy Inc. led the county on leases from 2010, and Hilcorp Energy Company has led since 2016, when it took the lead with 26 leases. Leases also changed hands before that, including 22 leases that passed from Milagro Exploration, LLC to White Oak Operating Company LLC in 2015.
Kaler Energy Corp. reported 47.1% of the county's oil and gas, counted in barrels of oil equivalent, in the last 12 months, from 4 producing leases. Four permits were filed in the last 12 months, against 2 in the 12 months before, and none is horizontal.
- 1999 Biggest full calendar year for oil: 3,813,696 barrels.
- 2000 Biggest gas year: 37,209,287 mcf; Capco Resources leads with 25 leases.
- 2008 Erg Resources, L.L.C. takes the lead with 31 leases.
- 2010 XTO Energy Inc. takes the lead with 29 leases.
- 2014 Oil makes more of the county's output than gas.
- 2016 Hilcorp Energy Company takes the lead with 26 leases.
- 2024 Oil makes more of the output again; Hilcorp leads with 25 leases.
State records through July 2026.
Not a forecast, not reserves.
219 producing counties, biggest first
102nd in Texas for oil, 133rd for gas
Each line is one Texas county, drawn to what it sold in the last 12 months. Galveston County is the blue one. In 1993 it was 83rd for oil and 107th for gas.
of all Texas oil in the last 12 months.
of all Texas gas.
operators. The biggest is Hilcorp Energy Company.
fields. The biggest is High Island.
SourceTexas Railroad Commission Production Data Query, every county, August 2025 to July 2026.
For mineral owners, from the state record
What Galveston County owners ask
- 01Who pays royalties in Galveston County?
- Sandpoint Texas LLC18Hilcorp Energy Company11Kaler Energy Corp.4
- 12 operators run the county's producing leases. The one that pays you is the company named on your check stub. Sandpoint Texas LLC runs the most leases, 18 of the 46.
- Source: Railroad Commission production reports, operator of record.
- Find the operator of your lease
- 02If oil or gas sold in July 2026, when would a regular check be due?
- Jul 31sale month endsSep 29oil dueOct 29gas due
- For a subsequent sale in July 2026, the usual Texas deadlines would be September 29, 2026 for oil and October 29, 2026 for gas. These are 60 and 90 days after month-end when the written agreement sets no payment schedule. First sales follow a different rule.
- Source: Railroad Commission production reports; Texas Natural Resources Code §91.402.
- See your next three checks
- 03Why did my Galveston County check change?
- Oil sold▲ 24.9%Oil price▲ 6.53%Gas sold▼ 22.4%Gas price▲ 17.5%
- Across the county, oil sold is up 24.9% on the 12 months before and the oil price is up 6.53%. In the same months gas sold is down 22.4% and the gas price up 17.5%. A check can move with the county's volume and the price with nothing wrong on the lease. The statement check tells the two apart.
- Source: Railroad Commission production reports; U.S. Energy Information Administration prices.
- Why is my check lower?
- 04Who runs most of the county's output now?
- Kaler Energy Corp. reported 47.1% of the county's oil and gas, counted in barrels of oil equivalent, in the last 12 months. The 3 biggest operators reported 79.1% together. Hilcorp Energy Company is the leading operator on leases, with 21 leases reporting so far in 2026.
- 05How does the county's oil compare with its biggest year?
- Oil in the last 12 months is about a tenth of 1999, the biggest full calendar year for oil: 11.3%. The biggest full calendar year for gas was 2000, with 37,209,287 mcf. Gas in the last 12 months is less than a tenth of that year: 4.2%.
- 06Who took over leases here, and when?
- Linc Gulf Coast Petroleum, Inc. took over 25 leases from Erg Resources, L.L.C. in 2011. White Oak Operating Company LLC took over 22 leases from Milagro Exploration, LLC in 2015. In 2016, Progenies Operating LLC took over 22 leases from White Oak Operating Company LLC.
- 07How many leases are still producing, and do they have old records?
- The state shows 46 producing leases and 115 leases on record in the county. 18 of the 46 producing leases have reports back to January 1993: a little over a third of them.
- Mineral interest finder
- 08Are new drilling permits still being filed here?
- Yes. 4 permits were filed in the last 12 months, against 2 in the 12 months before. The permits came from 4 operators, and none is horizontal. The permit file shows 2 permits in 2023, 4 in 2024, 2 in 2025 and 3 in 2026.
- Find the land on my deed
403 months against seven other recordsNew
Every month since January 1993, and what else happened that month
The whole county is the line on top. Under it, on the same clock: the weather, the price, how many leases reported, new wells, takeovers, State cut-offs and leases that went silent. Move across it.
Oil averaged $59.04 a barrel · 28 leases reporting
- WeatherCold, February 15 to 16, 2021. One day below 20°F in Galveston County.
- StateThe State cut off 4 leases' right to sell this month. The most common reason on file: Delinquent H-15 (inactive well test).
- Reports30 leases reported nothing this month, inside a run of silent months.
Move the pointer or drag across the chart. The numbered buttons jump to each month.
Monthly production of the whole county with seven aligned record tracks beneath it. Use the left and right arrow keys to move month by month.. 403 months from January 1993 to July 2026. The most in one month: 361,047 barrels, July 1999. The newest month: 31,489 barrels. Moments marked: 1, May 2001; 2, Jun 2001; 3, Oct 2002; 4, Sep 2008; 5, May 2020; 6, Feb 2021.
SourcesProduction, leases, new wells, takeovers, cut-offs and silent leases: Railroad Commission of Texas, reported through July 2026. Weather: NOAA storm reports, record dated October 26, 2026. Prices: U.S. Energy Information Administration, through October 2026. An empty lane means nothing of that kind on the records read. A record in the same month is not proof of a cause.
Royalty Watch tells you the month your own lease starts to drop, with the records from that month.See Royalty Watch
34 years of state records, 1993 to 2026
Oil and gas by year, back to January 1993
$3.0billion
What the county's oil and gas sold for at each month's public prices, before tax and the operators' deductions.
- Oil sold
- 38.6 millionbarrels
- Gas sold
- 349 billioncubic feet
- Sold the most
- 2008$281.4 million sold
| Year | Oil, dollars | Gas, dollars | Total |
|---|---|---|---|
| 1993 | $28 million | $19.7 million | $47.7 million |
| 1994 | $24.7 million | $17.9 million | $42.7 million |
| 1995 | $22.5 million | $15.7 million | $38.2 million |
| 1996 | $28.7 million | $29.3 million | $58 million |
| 1997 | $22.1 million | $29.4 million | $51.5 million |
| 1998 | $30.4 million | $42.7 million | $73.1 million |
| 1999 | $73.7 million | $75.1 million | $148.9 million |
| 2000 | $98.5 million | $157 million | $255.6 million |
| 2001 | $64.1 million | $113.7 million | $177.9 million |
| 2002 | $61.2 million | $82 million | $143.3 million |
| 2003 | $65.4 million | $105.3 million | $170.8 million |
| 2004 | $69.2 million | $115.9 million | $185.1 million |
| 2005 | $77.9 million | $115 million | $192.9 million |
| 2006 | $95.6 million | $80.6 million | $176.2 million |
| 2007 | $112.1 million | $96.1 million | $208.2 million |
| 2008 | $156.9 million | $124.4 million | $281.4 million, sold the most |
| 2009 | $75.9 million | $49.3 million | $125.2 million |
| 2010 | $82.5 million | $38.3 million | $120.8 million |
| 2011 | $81.9 million | $25.3 million | $107.3 million |
| 2012 | $58.8 million | $15.6 million | $74.4 million |
| 2013 | $50.6 million | $16.6 million | $67.2 million |
| 2014 | $51.8 million | $13.9 million | $65.8 million |
| 2015 | $22.8 million | $6.9 million | $29.7 million |
| 2016 | $15.8 million | $4.6 million | $20.5 million |
| 2017 | $14.1 million | $5.2 million | $19.3 million |
| 2018 | $15.9 million | $4.3 million | $20.2 million |
| 2019 | $12 million | $2.2 million | $14.3 million |
| 2020 | $8.1 million | $1.6 million | $9.8 million |
| 2021 | $11.1 million | $2.8 million | $14 million |
| 2022 | $15.6 million | $11.2 million | $26.9 million |
| 2023 | $17.6 million | $3.7 million | $21.4 million |
| 2024 | $23.2 million | $3.3 million | $26.6 million |
| 2025 | $26.2 million | $7.5 million | $33.7 million |
| 2026, to July | $20.4 million | $2.8 million | $23.2 million |
For research and teaching
Source: Royalty Clerk analysis of Texas Railroad Commission filings, https://royaltyclerk.com/texas/counties/galveston-county-tx, data to July 2026.
Galveston County oil and gas by year, 1993 to 2026
| Year | Oilbbl | Gasmcf | Sold forat that month's prices |
|---|---|---|---|
| 2026, to July | 242,418 | 740,386 | $23.2 million |
| 2025 | 403,027 | 2,125,280 | $33.7 million |
| 2024 | 303,731 | 1,554,173 | $26.6 million |
| 2023 | 228,373 | 1,519,017 | $21.4 million |
| 2022 | 165,582 | 1,667,958 | $26.9 million |
| 2021 | 163,796 | 715,684 | $14 million |
| 2020 | 206,122 | 799,713 | $9.8 million |
| 2019 | 211,918 | 884,157 | $14.3 million |
| 2018 | 244,964 | 1,417,439 | $20.2 million |
| 2017 | 277,580 | 1,748,295 | $19.3 million |
| 2016 | 371,019 | 1,890,708 | $20.5 million |
| 2015 | 467,008 | 2,620,973 | $29.7 million |
| 2014 | 556,645 | 3,235,925 | $65.8 million |
| 2013 | 517,920 | 4,482,146 | $67.2 million |
| 2012 | 627,063 | 5,522,679 | $74.4 million |
| 2011 | 864,133 | 6,274,826 | $107.3 million |
| 2010 | 1,041,927 | 8,622,805 | $120.8 million |
| 2009 | 1,234,084 | 12,581,608 | $125.2 million |
| 2008 | 1,533,206 | 13,669,074 | $281.4 million |
| 2007 | 1,537,104 | 13,845,302 | $208.2 million |
| 2006 | 1,451,293 | 11,961,532 | $176.2 million |
| 2005 | 1,382,443 | 13,491,584 | $192.9 million |
| 2004 | 1,699,011 | 19,706,772 | $185.1 million |
| 2003 | 2,119,161 | 19,558,326 | $170.8 million |
| 2002 | 2,398,026 | 25,246,427 | $143.3 million |
| 2001 | 2,513,884 | 28,421,142 | $177.9 million |
| 2000 | 3,267,864 | 37,209,287 | $255.6 million |
| 1999 | 3,813,696 | 32,880,271 | $148.9 million |
| 1998 | 2,172,498 | 20,890,423 | $73.1 million |
| 1997 | 1,073,137 | 11,750,763 | $51.5 million |
| 1996 | 1,301,062 | 12,813,074 | $58 million |
| 1995 | 1,222,638 | 9,771,673 | $38.2 million |
| 1994 | 1,434,638 | 9,518,486 | $42.7 million |
| 1993 | 1,513,292 | 9,456,159 | $47.7 million |
SourcesRailroad Commission Production Data Query, every monthly report since January 1993. EIA monthly WTI and Henry Hub prices, and the Texas wellhead gas price before 1997. 2026 is part of a year, drawn lighter. Not a forecast, not reserves.
Royalty interests
The county mineral roll
Galveston County's 2026 mineral roll is loaded here and can be searched by family name. This page prints a roll's figures only from the estate study, which publishes a county only when its roll has enough records to keep every owner private, and the study has no published figures for Galveston County.
SourceCounty appraisal district mineral roll, as loaded here, and the Royalty Clerk estate study. Checked for Galveston County. Record dated October 7, 2026.
The mineral interest finder searches every roll loaded here by family name, and links the appraisal districts it cannot search.Search a family name
46 producing leases
Biggest leases in Galveston County now
Most oil leases here are small. The bars count the county's oil leases by how much oil each sold in the last 12 months. Find your lease and its bar turns blue.
Search, sort and filter all 46 producing leases
Under each volume: change on the year before.
64,024bbl oil+40%
960,447mcf gas−25%
39,832bbl oil+6%
39,637bbl oiln/a
36,608bbl oiln/a
31,260bbl oil+15%
18,916bbl oil+75%
17,375bbl oil−53%
17,123bbl oiln/a
248,213mcf gas−31%
9,658bbl oiln/a
8,631bbl oil−18%
8,489bbl oil+140%
8,478bbl oil+9%
6,278bbl oiln/a
5,586bbl oil−4%
113,187mcf gas−3%
2,943bbl oiln/a
2,734bbl oil−5%
2,499bbl oil+18%
2,045bbl oil+348%
1,900bbl oil+15%
1,865bbl oil−12%
1,727bbl oil−1%
1,525bbl oil+79%
Showing 25 of 46, ranked by output value.
SourceTexas Railroad Commission Production Data Query, through July 2026. 69 more leases are on record and not producing.
12 operators, 22 fields
Who runs the leases, and what they produce
Operators ranked by output now
- 1Hilcorp Energy Company134,713bbl11 leases · 31.2% of the county's oil
- 2Kaler Energy Corp.95,528bbl4 leases · 22.1% of the county's oil
- 3Gcows Operating LLC41,732bbl2 leases · 9.66% of the county's oil
- 4Big Lake Corporation40,846bbl3 leases · 9.46% of the county's oil
- 5Frio Resources, LLC39,637bbl1 lease · 9.18% of the county's oil
- 6Sandpoint Texas LLC34,299bbl18 leases · 7.94% of the county's oil
Fields ranked by output now
- 1High Island65,435bbl19 leases · 15.2% of the county's oil · District 03 · Field 41139001
- 2League City (9700)64,024bbl1 lease · 14.8% of the county's oil · District 03 · Field 52676875
- 3Sarah White, East (9200)43,501bbl1 lease · 10.1% of the county's oil · District 03 · Field 81038800
- 4Gillock (Big Gas)41,732bbl2 leases · 9.66% of the county's oil · District 03 · Field 34925037
- 5League City (9275)39,637bbl1 lease · 9.18% of the county's oil · District 03 · Field 52676850
- 6Sarah White (Frio 9225)36,608bbl1 lease · 8.48% of the county's oil · District 03 · Field 81037400
- 7Franks, NW. (8900)30,139bbl3 leases · 6.98% of the county's oil · District 03 · Field 32692500
- 8League City (9000 Best)17,375bbl1 lease · 4.02% of the county's oil · District 03 · Field 52676800
- 9Franks (8900 Sand)17,123bbl1 lease · 3.97% of the county's oil · District 03 · Field 32688936
- 10League City, West (Anomalina)14,129bbl2 leases · 3.27% of the county's oil · District 03 · Field 52683500
Drilling permits filed in recent years
| Lease and well | Operator | Filed as | Permit | Approved |
|---|---|---|---|---|
| STEWART TITLE 1 | Frio Resources, LLC | Recompletion | 0916817 | Jul 6, 2026 |
| MOODY ESTATE TRUSTEE 1 | Sandpoint Texas LLC | Recompletion | 0914839 | Apr 16, 2026 |
| TIDWELL 3 | Kaler Energy Corp. | Recompletion | 0913807 | Mar 3, 2026 |
| FRANKS /8900 SAND/ UNIT 3 | Hilcorp Energy Company | Recompletion | 0911788 | Nov 19, 2025 |
| FRANKS /8900 SAND/ UNIT 4 | Hilcorp Energy Company | Recompletion | 0908798 | Jun 24, 2025 |
| SUNNY ERNST 1 | Quidnet Energy Deployment LLC | Recompletion | 0901798 | Aug 6, 2024 |
Oil, July 2026, dollars a barrelNew
What oil sold for in July 2026, and what the tax office has on file
Each operator tells the Texas Comptroller the price it got for each lease. Those prices have not reached our records for Galveston County yet, so this part shows the market price and what the operators' parent companies told their investors. Each lease page shows its own price once the Comptroller's records arrive.
The State approved a lower tax on 22 of the 46 leases
- TWO YEAR INACTIVE WELL
- 11 leases
- TWO YEAR INACTIVE WELL
- 11 leases
- LOW PRODUCING LEASES
- 8 leases
- LOW PRODUCING WELLS
- 3 leases
- Rate, oil
- 0%
4.60% - Newest approval
- July 2026
47.8% of the county's producing leases
On those leases the tax line on a statement should show the lower rate. Each lease page says which wells and until when.
Your statement: the price on your own check stub for a Galveston County lease is the one to set beside the market, the operator's and the tax office's. Check my statement
SourcesMarket: U.S. Energy Information Administration, WTI Cushing. Tax approvals: Texas Comptroller. Leases sell at different points and qualities, so prices differ for ordinary reasons too.
Watch Plus sets these prices beside the price on each of your statements, every month.See Watch Plus
Who buys the gasNew
Who buys Galveston County's gas
The State lists who buys from each lease. Company filings and the State's operator records show which companies are linked. Each bar is one operator's gas, split by buyer, and every split is an estimate: this record split a lease's gas evenly among its buyers where the P-4 gives no percent, and does not say which splits those are, so no share of the county's gas is stated.
SourcesBuyers and gatherers: Railroad Commission Form P-4 records, record dated October 24, 2026, weighted by each lease's gas sold in the 12 months to July 2026. Links: U.S. Securities and Exchange Commission filings and the Railroad Commission's P-5 organization reports. A link marks one buyer under one operator, never the rest of a lease's or the county's gas. This record does not show that each buyer and operator pair here was checked for a link, so a buyer not marked is not known to be unrelated.
Royalty Watch tells you the day the buyer of your oil or gas changes.See Royalty Watch
Seen from space, 2025New
Heat at 1 lease in 12 lease months. Flaring reported in 0 of them.
Weather satellites pass over Texas every night and record heat on the ground. For each operator, the amber bar counts the lease months a satellite saw heat at one of its leases. The outlined bar counts the months it reported flaring there.
lease with heat seen at night in 2025.
of 12 lease months with heat also had flaring reported.
lease months with heat seen and a report on file listing no flaring.
Where the county's gas went in 2025, as operators reported it
SourcesHeat: VIIRS active fire readings at night from NOAA-20, NOAA-21 and Suomi NPP (NOAA open data), matched to a lease's wells; a GOES-East reading alone never counts as a night. Satellite record read to November 16, 2026. Reported flaring and gas use: Railroad Commission production reports. Cloud hides heat, so the count is a floor. The satellite records heat. It does not say what burned.
Watch Plus checks whether you were paid on gas in the months heat was seen at your lease.See Watch Plus
Permits, drilling and fracsNew
5 wells on the way
The State approved 5 drilling locations here in two years. These are the wells still between a permit and a first month of production, one dot for each, at the stage the records showed on November 17, 2026.
Approved, not started
Newest approval: Jun 24Being drilled
Spudded in the 30 days to Nov 17Drilled, no frac on record yet
No wait to countFracked, waiting on a report
No wait to countCompletion filed, no production yet
Middle wait: 209 daysSourcesPermits, drilling dates and completions: Railroad Commission of Texas. Frac dates: FracFocus chemical disclosure registry. Counted November 17, 2026. Newest permit on file for this county: July 6, 2026.
Royalty Watch tells you the day a well on your lease moves to its next stage.See Royalty Watch
Watch Private tells you when a permit or frac is recorded within a mile of your land.See Watch Private
See new drilling on the mapFull well mapPut this map on your site
Do your Galveston County checks match the State?
Own minerals here? Add your leases to My leases and see your share of every month.
Example
A whole month was never paid
The State shows 28,175 barrels of oil sold from the lease in the month its operator changed from Operator A to Operator B, so the owner's share is 27.51 barrels. No statement covers that month.
Ask Operator B's owner relations: is that month held in suspense after the change of operator?
$2,277oil and gas
A sample finding, from our example check.
Around this county
Nearby
Where it sits
This county
Towns
- Friendswood1,095 wells within 10 miles
- League City943 wells within 10 miles
- Clear Lake Shores458 wells within 10 miles
- Kemah402 wells within 10 miles
- Santa Fe280 wells within 10 miles
- Dickinson258 wells within 10 miles
- Hitchcock193 wells within 10 miles
- Bacliff185 wells within 10 miles
- La Marque183 wells within 10 miles
- Bayou Vista178 wells within 10 miles
- Texas City160 wells within 10 miles
- San Leon134 wells within 10 miles
- Tiki Island100 wells within 10 miles
- Jamaica Beach21 wells within 10 miles
- Bolivar Peninsula6 wells within 10 miles
- Galveston3 wells within 10 miles
Fields
- High Island19 leases
- League City, West (Anomalina)2 leases
- League City (9700)1 lease
- Sarah White, East (9200)1 lease
- League City (9275)1 lease
Newest drilling permits
- STEWART TITLE 1Recompletion · approved Jul 6 · Frio Resources, LLC
- MOODY ESTATE TRUSTEE 1Recompletion · approved Apr 16 · Sandpoint Texas LLC
- TIDWELL 3Recompletion · approved Mar 3 · Kaler Energy Corp.
- FRANKS /8900 SAND/ UNIT 3Recompletion · approved Nov 19 · Hilcorp Energy Company
- FRANKS /8900 SAND/ UNIT 4Recompletion · approved Jun 24 · Hilcorp Energy Company
More on Galveston County
- Every lease in Galveston County, A to Z108 lease pages, listed 100 to a page.
- Every operator in Galveston County30 operators with leases here, the biggest first.
- Galveston County drilling permitsThe newest permits, completions and first production, free.
- Galveston County lease offersWhat the State and other owners were offered per acre.
- Texas operators, A to ZEvery operator with producing leases, and its report card.
- Check a stub against a leaseMatch the barrels and mcf on your stub to the state record.
- Kaler Energy Corp.Kaler reported 47.1% of county output in the last 12 months.
- Hilcorp Energy CompanyLeading operator on leases since 2016, with 11 producing leases here.
- Frio Resources, LLCFiled one of the 4 permits in the last 12 months.
- League City, West (Anomalina)Top field now by output, with 2 producing leases.
- High IslandField with 39 leases on record and 19 producing now.
Where this page comes from
- Railroad Commission of Texas production, Form P-4, permits, wells, cut-offs
- Texas Comptroller tax approvals
- U.S. Energy Information Administration prices
- SEC EDGAR company filings
- FracFocus frac dates
- NOAA storms and cold
- NOAA open data VIIRS night heat (NOAA-20, NOAA-21, Suomi NPP)
- U.S. Census Bureau county shapes