
The Texas record · 215 producing counties · 145,711 producing leases
Texas oil and gas
Find the lease on your royalty check stub and see what the state recorded for it. Texas reported 2.03 billion barrels of oil and 13.83 billion mcf of gas in the 12 months through Jul 2026, by county, operator, field and lease, from the Railroad Commission.
Data through Jul 2026 · updated Oct 30, 2026
August 2026 is still coming in. About 89% of Texas leases have reported it so far, so this page counts through July 2026 until it is fully reported.
- Free to read, no account
- Every county, lease, operator and field
- Each lease’s history back to January 1993
- From Railroad Commission filings
- For research and teaching: cite and download ↓
Search the lease name on your check stub
An operator, field or county name works too. Looking for a family name? Estate, heirs and trust leases by county
Loading the county map…
Oil sold by county
- Oil, last 12 months
- 2,034,599,737 bbl
- Gas, last 12 months
- 13,833,543,428 mcf
- Producing leases
- 145,711of 223,162 on record
- Operators
- 4,500
- Wells on record
- 510,760on leases with production reports
- This page counts through
- Jul 2026
NewThe Texas well map
See the wells around your land
Wells and two years of drilling permits on the USGS topo map or satellite, with the survey lines deeds use, a list of what is near any spot and tools to mark your land. Free, no account needed.
Open the Texas well map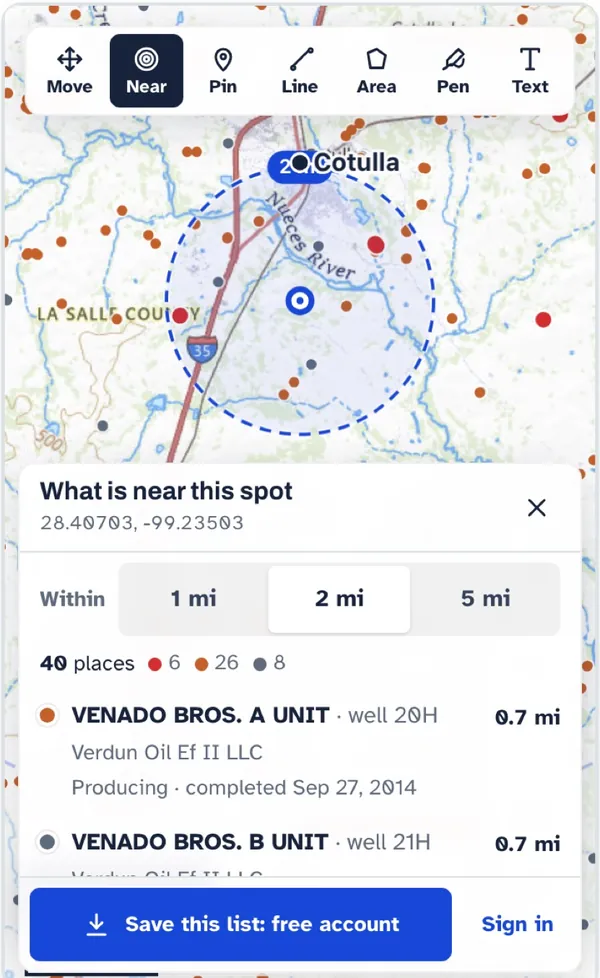
What this means for your check
In the 12 months through Jul 2026, Texas sold 3% less oil than the year before, and WTI averaged $74.28 a barrel, 7% above the year before. An oil royalty that moved with the state would be about 3% higher, before taxes and deductions. For gas: 4% more sold, at $3.60 per MMBtu at Henry Hub (18% above), about 22% higher together.
Your own lease can move very differently. If your checks changed by much more than this, something besides the market may have changed: the lease’s own production, the deductions, or your decimal.
Production
Five years of Texas output
Oil output in Texas fell 3% over the last 12 months
2B bbl through Jul 2026, against 2.1B bbl a year earlier. Peak Oct 2024: 181M bbl.
Gas output in Texas rose 4% over the last 12 months
14B mcf through Jul 2026, against 13B mcf a year earlier. Peak Dec 2025: 1.2B mcf.
SourceTexas Railroad Commission, Production Data Query, all leases. Reported through Jul 2026, file dated Oct 20, 2026.
For research and teaching
Free to read, cite and teach with
- What is here
- Oil and gas reported for every Texas county, operator, field and lease, through July 2026, with the newest drilling permits. Each lease page shows its history year by year back to January 1993 and its last three years month by month; the county map goes year by year back to January 1993; county, operator and field pages show the recent years month by month. 223,162 leases on record.
- Where it comes from
- The Railroad Commission of Texas Production Data Query and drilling permit files, as the state publishes them; oil and gas prices from the U.S. Energy Information Administration.
- Reuse
- Quote or chart any figure with a credit to Royalty Clerk and a link to the page it came from (our terms). The county file is free for research and teaching under CC BY-NC 4.0.
- Already cited
- The Midland Reporter-Telegram used the Midland County figures on Nov 5, 2026: “Midland County produced 2.35 billion barrels from 1993-2026”.
Charts to embed, a fact sheet and more credit lines are on the media page. Need a cut that is not here? Write to press@royaltyclerk.com.
Cite this page
Source: Royalty Clerk compilation of Railroad Commission of Texas production filings (1993–2026) and county mineral appraisal rolls (royaltyclerk.com/texas).
If you use these figures, please credit Royalty Clerk and link this page.
For a reference list
Royalty Clerk. (2026). Texas oil and gas production by county, operator, field and lease, data through July 2026 [Data set]. Compiled from Railroad Commission of Texas filings. https://royaltyclerk.com/texas
- This page counts through
- July 2026, updated Oct 30, 2026
- Access
- Free, no account
- County file DOI
- 10.5281/zenodo.23818209
- County file license
- CC BY-NC 4.0
To cite the county file (version 2026-08, one row per county)
Royalty Clerk (2026). Texas Oil & Gas Production and County Mineral Appraisal Summary (1993–2026) (version 2026-08, data through August 2026) [Data set]. Zenodo. https://doi.org/10.5281/zenodo.23818209
Counties
Where the oil and gas come from
Top oil counties, last 12 months
Martin leads
- Martin County3,874 producing leases261Mbbl
- Midland County3,547 producing leases242Mbbl
- Loving County2,725 producing leases173Mbbl
- Reeves County4,472 producing leases170Mbbl
- Upton County2,727 producing leases112Mbbl
- Howard County2,159 producing leases83Mbbl
- Karnes County2,541 producing leases81Mbbl
- Reagan County2,173 producing leases75Mbbl
- Andrews County2,098 producing leases65Mbbl
- Ward County1,660 producing leases64Mbbl
Top gas counties, last 12 months
Webb leads
- Webb County6,466 producing leases1.3Bmcf
- Reeves County4,472 producing leases1.2Bmcf
- Midland County3,547 producing leases1Bmcf
- Martin County3,874 producing leases799Mmcf
- Loving County2,725 producing leases702Mmcf
- Panola County4,581 producing leases689Mmcf
- Culberson County1,180 producing leases592Mmcf
- Reagan County2,173 producing leases539Mmcf
- Harrison County2,219 producing leases498Mmcf
- Upton County2,727 producing leases480Mmcf
All 215 producing counties, A to Z
- Anderson
- Andrews
- Angelina
- Aransas
- Archer
- Atascosa
- Austin
- Bandera
- Bastrop
- Baylor
- Bee
- Bexar
- Borden
- Bowie
- Brazoria
- Brazos
- Brooks
- Brown
- Burleson
- Caldwell
- Calhoun
- Callahan
- Camp
- Carson
- Cass
- Chambers
- Cherokee
- Childress
- Clay
- Cochran
- Coke
- Coleman
- Collingsworth
- Colorado
- Comanche
- Concho
- Cooke
- Cottle
- Crane
- Crockett
- Crosby
- Culberson
- Dallas
- Dawson
- De Witt
- Denton
- Dickens
- Dimmit
- Donley
- Duval
- Eastland
- Ector
- Edwards
- Ellis
- Erath
- Falls
- Fayette
- Fisher
- Foard
- Fort Bend
- Franklin
- Freestone
- Frio
- Gaines
- Galveston
- Garza
- Glasscock
- Goliad
- Gonzales
- Gray
- Grayson
- Gregg
- Grimes
- Guadalupe
- Hale
- Hamilton
- Hansford
- Hardeman
- Hardin
- Harris
- Harrison
- Hartley
- Haskell
- Hemphill
- Henderson
- Hidalgo
- Hill
- Hockley
- Hood
- Hopkins
- Houston
- Howard
- Hunt
- Hutchinson
- Irion
- Jack
- Jackson
- Jasper
- Jefferson
- Jim Hogg
- Jim Wells
- Johnson
- Jones
- Karnes
- Kaufman
- Kenedy
- Kent
- Kimble
- King
- Kleberg
- Knox
- La Salle
- Lamb
- Lavaca
- Lee
- Leon
- Liberty
- Limestone
- Lipscomb
- Live Oak
- Loving
- Lubbock
- Lynn
- Madison
- Marion
- Martin
- Matagorda
- Maverick
- McCulloch
- McLennan
- McMullen
- Medina
- Menard
- Midland
- Milam
- Mitchell
- Montague
- Montgomery
- Moore
- Morris
- Motley
- Nacogdoches
- Navarro
- Newton
- Nolan
- Nueces
- Ochiltree
- Oldham
- Orange
- Palo Pinto
- Panola
- Parker
- Pecos
- Polk
- Potter
- Presidio
- Reagan
- Real
- Red River
- Reeves
- Refugio
- Roberts
- Robertson
- Runnels
- Rusk
- Sabine
- San Augustine
- San Jacinto
- San Patricio
- Schleicher
- Scurry
- Shackelford
- Shelby
- Sherman
- Smith
- Somervell
- Starr
- Stephens
- Sterling
- Stonewall
- Sutton
- Tarrant
- Taylor
- Terrell
- Terry
- Throckmorton
- Titus
- Tom Green
- Travis
- Trinity
- Tyler
- Upshur
- Upton
- Val Verde
- Van Zandt
- Victoria
- Walker
- Waller
- Ward
- Washington
- Webb
- Wharton
- Wheeler
- Wichita
- Wilbarger
- Willacy
- Williamson
- Wilson
- Winkler
- Wise
- Wood
- Yoakum
- Young
- Zapata
- Zavala
Offshore areas in the Gulf (4)
Operators and fields
The companies that write the checks
Top operators by oil, last 12 months
Pioneer Natural Res. USA leads
- Pioneer Natural Res. USA, Inc.5,710 leases228Mbbl
- Diamondback E&P LLC4,840 leases221Mbbl
- Anadarko E&P Onshore LLC1,475 leases84Mbbl
- EOG Resources, Inc.4,585 leases83Mbbl
- Burlington Resources O & G Co LP1,400 leases57Mbbl
- Apache Corporation2,319 leases57Mbbl
- XTO Energy Inc.2,337 leases55Mbbl
- Cog Operating LLC1,492 leases53Mbbl
- BPX Operating Company1,705 leases52Mbbl
- Chevron U. S. A. Inc.984 leases44Mbbl
Top fields by oil, last 12 months
Spraberry (Trend Area) leads
- Spraberry (Trend Area)11,301 producing leases · District 08698Mbbl
- Phantom (Wolfcamp)6,282 producing leases · District 08304Mbbl
- Spraberry (Trend Area)4,030 producing leases · District 7C168Mbbl
- Eagleville (Eagle Ford-2)2,707 producing leases · District 02121Mbbl
- Eagleville (Eagle Ford-1)4,404 producing leases · District 01116Mbbl
- Sandbar (Bone Spring)995 producing leases · District 0857Mbbl
- Ford, West (Wolfcamp)1,124 producing leases · District 0847Mbbl
- Briscoe Ranch (Eagleford)4,407 producing leases · District 0144Mbbl
New drilling
The latest drilling permits
Newest W-1 permits
RUSTY CRANE 604 #5H
new drill · horizontal · Riley Permian Operating Co, LLC · Yoakum County
Permit 0920043 · Nov 13, 2026
RUSTY CRANE 604 #4H
new drill · horizontal · Riley Permian Operating Co, LLC · Yoakum County
Permit 0920042 · Nov 13, 2026
BENNETT RANCH UNIT #4368
recompletion · horizontal · Occidental Permian Ltd. · Yoakum County
Permit 0920056 · Nov 13, 2026
BENNETT RANCH UNIT #4347
recompletion · horizontal · Occidental Permian Ltd. · Yoakum County
Permit 0920058 · Nov 13, 2026
BENNETT RANCH UNIT #3421
recompletion · horizontal · Occidental Permian Ltd. · Yoakum County
Permit 0920044 · Nov 13, 2026
BENNETT RANCH UNIT #3340
recompletion · horizontal · Occidental Permian Ltd. · Yoakum County
Permit 0920055 · Nov 13, 2026
SEALY RANCH #6903H
new drill · horizontal · Halcon Operating Co., Inc. · Winkler County
Permit 0919639 · Nov 13, 2026
NEAL-HIRSCH 20N #14H
new drill · horizontal · Pioneer Natural Res. USA, Inc. · Upton County
Permit 0919235 · Nov 13, 2026
SourceTexas Railroad Commission, drilling permit (W-1) master file, through Nov 13, 2026.
Browse
Every operator, field and county page
- Texas dataPlays and basinsThe Permian, Eagle Ford, Barnett, Haynesville and Granite Wash on one map, with their counties and operators.
- Texas dataWells by ZIP codeType a ZIP code: the wells in it and within 3 miles, the newest permits and the operators, on a map.
- Texas dataNew drilling permits this weekEvery permit the state issued in the last seven days, on a map, by county and operator.
- Texas dataMonthly county reportsOil and gas leaders, statewide totals and changes from the same month a year earlier.
- Texas dataOperators, A to ZEvery operator with producing leases, with its leases and counties.
- Texas dataFields, A to ZEvery field with producing leases, and the operators in it.
- Texas dataOperator report cardsRealized price, leases that changed hands, buyers and permits.
- Texas dataEstate, heirs and trust leasesLeases named for an estate, heirs or a trust, by county, since 1993.
- Texas dataFindings from the county rollsEvery count we published from the county mineral rolls, with tables and CSVs.
- Texas dataWhere royalty accounts are mailedCounty-roll records by mailing state and city, and each county's share mailed out of state.
- Texas dataAccounts still in an estate's nameHow many royalty records on the county rolls are titled to an estate, by county.
- Texas dataDrilling activity by countyPermits, completions and first production, updated as the state files them.
- Texas dataLease offers by countyWhat the State and other owners were offered per acre.
- Texas dataCounty map, year by yearOil and gas in every county since 1993, with a slider and a table.
- Texas dataOil wells near Texas townsEvery well and new drilling location within 10 miles of a town, mapped, with coordinates.
- HelpMineral property tax protestThe appraisal district, the deadline and the county's trend.
FAQ
Questions about the Texas numbers
How much oil and gas does Texas produce?
Texas reported 2.03 billion barrels of oil and 13.83 billion mcf of gas in the 12 months through Jul 2026, from 145,711 producing leases run by 4,500 operators, according to the Railroad Commission of Texas.
How do I find my lease?
A royalty stub prints a lease name and often a Railroad Commission district and lease number. Search the name here, open the county page, or browse the A to Z lists of operators and fields, then compare the oil and gas sold each month with your stub.
Who runs the leases, and is that the company that pays me?
The Railroad Commission names one operator for each lease. The check itself can come from the operator or from a purchaser or payor acting for it, so use the name on your stub and look up the lease to see who the state shows today.
How current are these numbers?
The state publishes lease and county production two to three months after the month it covers, so Jul 2026 is the newest month here. Drilling permits are shown as filed.
Can I cite these numbers or use them in a class?
Yes. The pages are free to read with no account. Quote or chart any figure with a credit to Royalty Clerk and a link to the page, and cite the county file by its DOI, 10.5281/zenodo.23818209 (CC BY-NC 4.0). The credit line and citations are in the research section of this page.