
RRC field 21292001 · District 08
Cowden, South
The Cowden, South field reported 195,330 barrels of oil and 29,649 mcf of gas in the last 12 months.
Field dossier
- Producing leases
- 43of 63 on record
- Operators
- 16
- Counties
- 1
- Biggest operator
- R3 Operating Corporation
Own minerals in this field?
A family member owned minerals here?
Search their name: a family member who owned minerals hereWhere the field sits
This county
- Gas, last 12 months
- 29,649 mcf
- Data through
- Aug 2026
Wells in the Cowden, South field

- Drilling locations0Permits issued in the last two years
- Producing wells474On a lease reporting production now
- Not producing98Shut in, inactive or no lease on record
- Plugged492The state's wellbore record says plugged
Each dot is a well on a lease the Railroad Commission lists in the Cowden, South field, where its map puts it, or a drilling permit filed for the field in the last 24 months. Wells of other fields are not on this map. The picture is about 24 miles across. The white counties are the ones with a well or drilling permit of the field on the map. Five more wells have no location on the state's map. The thin brown lines are the original land surveys; where there is room, a survey carries its abstract number, the number deeds and division orders cite. Sources: Railroad Commission of Texas well layers, drilling permit files and survey lines, US Census Bureau county outlines, town points from GeoNames (CC BY 4.0).
Use this map on your site
You may show this map on any site, unchanged. Keep the credit line and its link to Royalty Clerk under the map. The picture updates by itself as the state records new wells and permits.
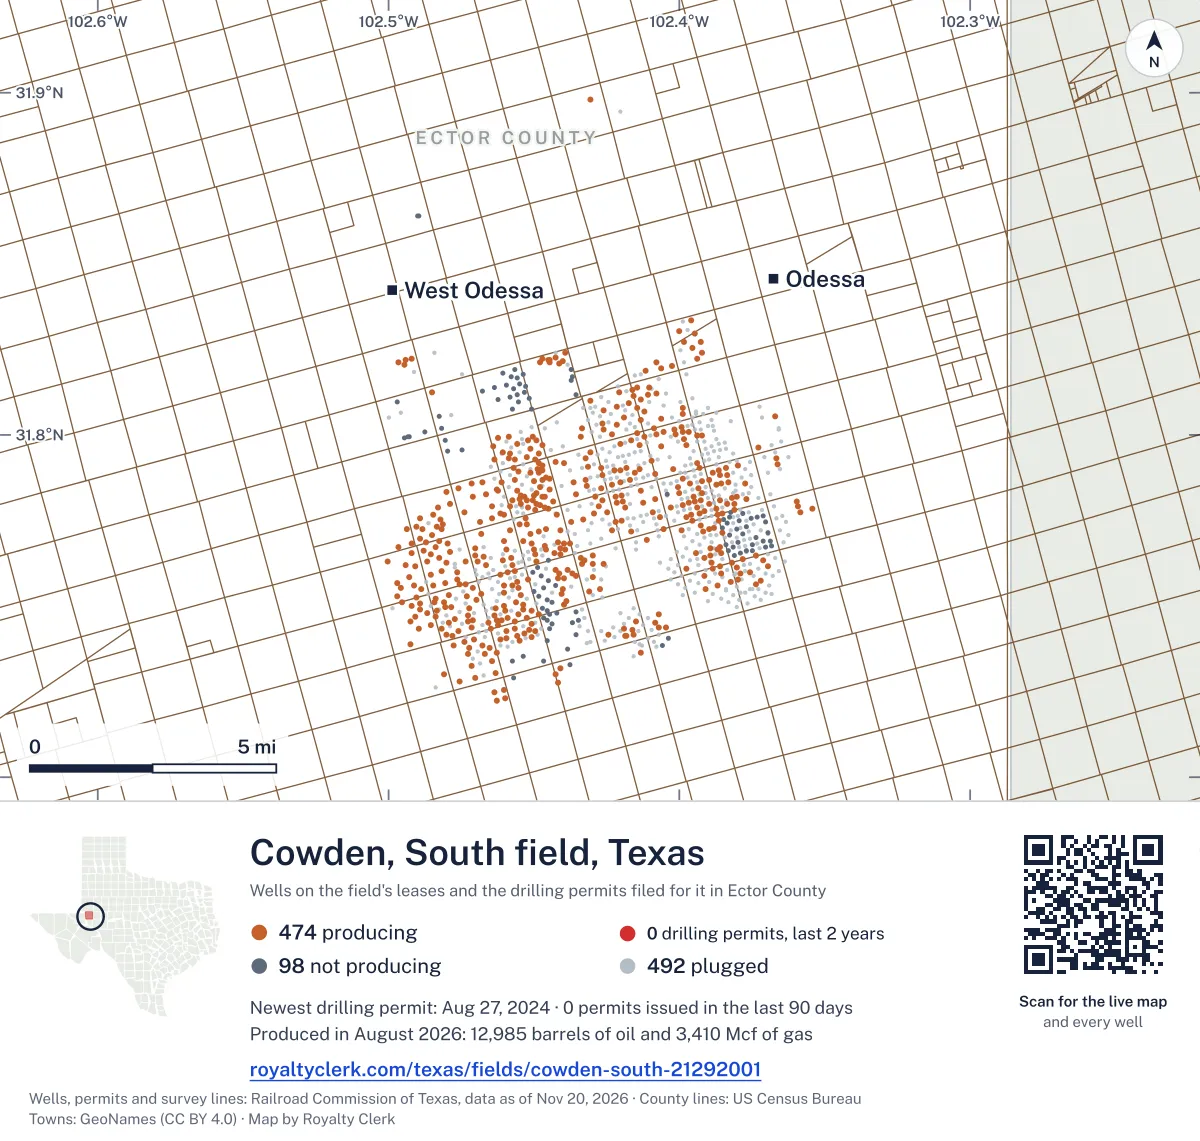
<a href="https://royaltyclerk.com/texas/fields/cowden-south-21292001"><img src="https://royaltyclerk.com/maps/field-wells/cowden-south-21292001.svg" alt="Map of the wells of the Cowden, South field, Texas: 1,064 wells and 0 recent drilling locations, in a picture about 24 miles across." width="1000" height="951" loading="lazy" style="max-width:100%;height:auto;border:0"></a>
<p style="margin:4px 0 0;font-size:14px">Map: <a href="https://royaltyclerk.com/texas/fields/cowden-south-21292001">Oil and gas wells of the Cowden, South field, Texas</a> by Royalty Clerk, from Railroad Commission of Texas records</p>
Oil has led output in every full year
Cowden, South is an oil field in Ector County where oil has made more output than gas in every full calendar year from 1993 to 2025. Of the leases on record in January 1993, 37 still produce. Petroleum Technical Services Co. held 10 leases then, and Conoco Inc. held 7.
Gas tells a different part of the story. Full-year gas output was 1,584,640 mcf in 2005 and 28,424 mcf in 2025. Oil output stayed the larger product throughout.
R3 Operating Corporation now runs the most output, with 28.4% of the field's barrels of oil equivalent. Of 1,214 wells on producing leases, 13 are horizontal.
Not a forecast, not reserves.
Key moments
- 1993Biggest full calendar year: 1,446,115 bbl oil, 602,506 mcf gas.
- 2005Gas output reaches 1,584,640 mcf in a full calendar year.
- 2008Oil output drops to 728,594 bbl, down from 893,072 in 2007.
- 201864 leases report output in the full calendar year.
- 2020Leases reporting fall to 54, down from 64 in 2019.
- 2025Last full year: 200,693 bbl oil and 28,424 mcf gas.
If you own here
- Royalty calculator
Oil is the larger product here, and the calculator turns volume, price and decimal into an estimated check.
Questions owners ask
- Who runs the leases in Cowden, South now?
- R3 Operating Corporation runs the most output now, with 28.4% of the field's barrels of oil equivalent. OXY USA Inc. follows with 19.3%, and Aghorn Operating, Inc. has 14.6%. The field has 16 operators in all, and its 63 leases are in Ector County.
- How much has gas output changed since 2005?
- Full-year gas output was 1,584,640 mcf in 2005 and 28,424 mcf in 2025. Oil made more output than gas in every full calendar year from 1993 to 2025. The page's chart shows both products month by month for the last five years. Gas royalty calculator
- Which lease here is the oldest producing one?
- Moss, Paul Unit, lease number 00875, is the oldest producing lease here. R3 Operating Corporation operates it. Its monthly reports run back to January 1993, the first month on record.
- How many wells in this field are horizontal?
- The field has 1,214 wells on producing leases. Thirteen of them are horizontal, which is 1.1% of those wells. The field lists no gas wells.
- What do the newest leases in this field show?
- Seven leases first reported between 2010 and 2019. Raptor Petroleum Develop, LLC and Adventure Operating Company, LLC were among the operators on those first reports. No lease here first reported in 2020 or later.
Related pages
- R3 Operating Corporation
Runs the most output here, with 28.4% of the field's oil equivalent.
- OXY USA Inc.
Operates seven producing leases here, with 19.3% of field output.
- Aghorn Operating, Inc.
Operates five producing leases here, with 14.6% of field output.
- Moss, Paul Unit
The oldest producing lease in the field, with reports back to January 1993.
- Ector County
The county where all 63 leases in this field sit, with 43 producing.
From the state's records through July 2026.
How much oil and gas has this field made?
Oil output in the Cowden, South field fell 5% over the last 12 months
195k bbl through Aug 2026, against 206k bbl a year earlier. Peak May 2022: 34.4k bbl.
Gas output in the Cowden, South field fell 22% over the last 12 months
29.6k mcf through Aug 2026, against 37.8k mcf a year earlier. Peak Nov 2021: 20.8k mcf.
SourceTexas Railroad Commission Production Data Query, field 21292001, through Aug 2026, file dated Oct 20, 2026.
Which leases here started and stopped, and when?
Under each volume: change on the year before.
55,311bbl oil−27%
22,461bbl oil−14%
13,209bbl oil+32%
11,692bbl oil+17%
8,629bbl oil+76%
8,470bbl oil+59%
6,999bbl oil+7%
5,866bbl oil−6%
5,508bbl oil−11%
3,370bbl oil+35%
3,355bbl oil−46%
3,348bbl oil−7%
3,012bbl oil+41%
2,861bbl oil−11%
2,612bbl oil+51%
2,453bbl oil+25%
2,415bbl oil−6%
2,321bbl oiln/a
2,177bbl oil+3%
1,870bbl oil−30%
1,852bbl oil−10%
1,803bbl oil−38%
- TXL -13-
08-16796OXY USA Inc.Ector County
1,768bbl oil+19%
1,662bbl oil−9%
1,546bbl oil−9%
Showing 25 of 43, ranked by output value.
SourceTexas Railroad Commission Production Data Query.
Who runs the leases in this field now?
Operators, by oil
R3 Operating leads
- R3 Operating Corporation1 lease55.3kbbl
- OXY USA Inc.7 leases35.1kbbl
- Aghorn Operating, Inc.5 leases28.6kbbl
- Occidental Permian Ltd.3 leases17.8kbbl
- Bluco Production Co., Inc.3 leases12.9kbbl
- Baker Operating, Inc.4 leases9,783bbl
- Vision Natural Resources, LP4 leases8,446bbl
- Laguna Petroleum Corporation2 leases5,967bbl
Recent drilling permits in Cowden, South
EMMONS UNIT 'A' #119
recompletion · Aghorn Operating, Inc. · Ector County
Permit 0901665 · Aug 27, 2024