
RRC field 30293333 · District 10
Farnsworth-Conner (Des Moines)
The Farnsworth-Conner (Des Moines) field reported 15,101 barrels of oil and 46,081 mcf of gas in the last 12 months.
Field dossier
- Producing leases
- 18of 36 on record
- Operators
- 10
- Counties
- 1
- Biggest operator
- Carson Buckles Exploration LLC
Own minerals in this field?
A family member owned minerals here?
Search their name: a family member who owned minerals hereWhere the field sits
This county
- Gas, last 12 months
- 46,081 mcf
- Data through
- Jul 2026
Wells in the Farnsworth-Conner (Des Moines) field

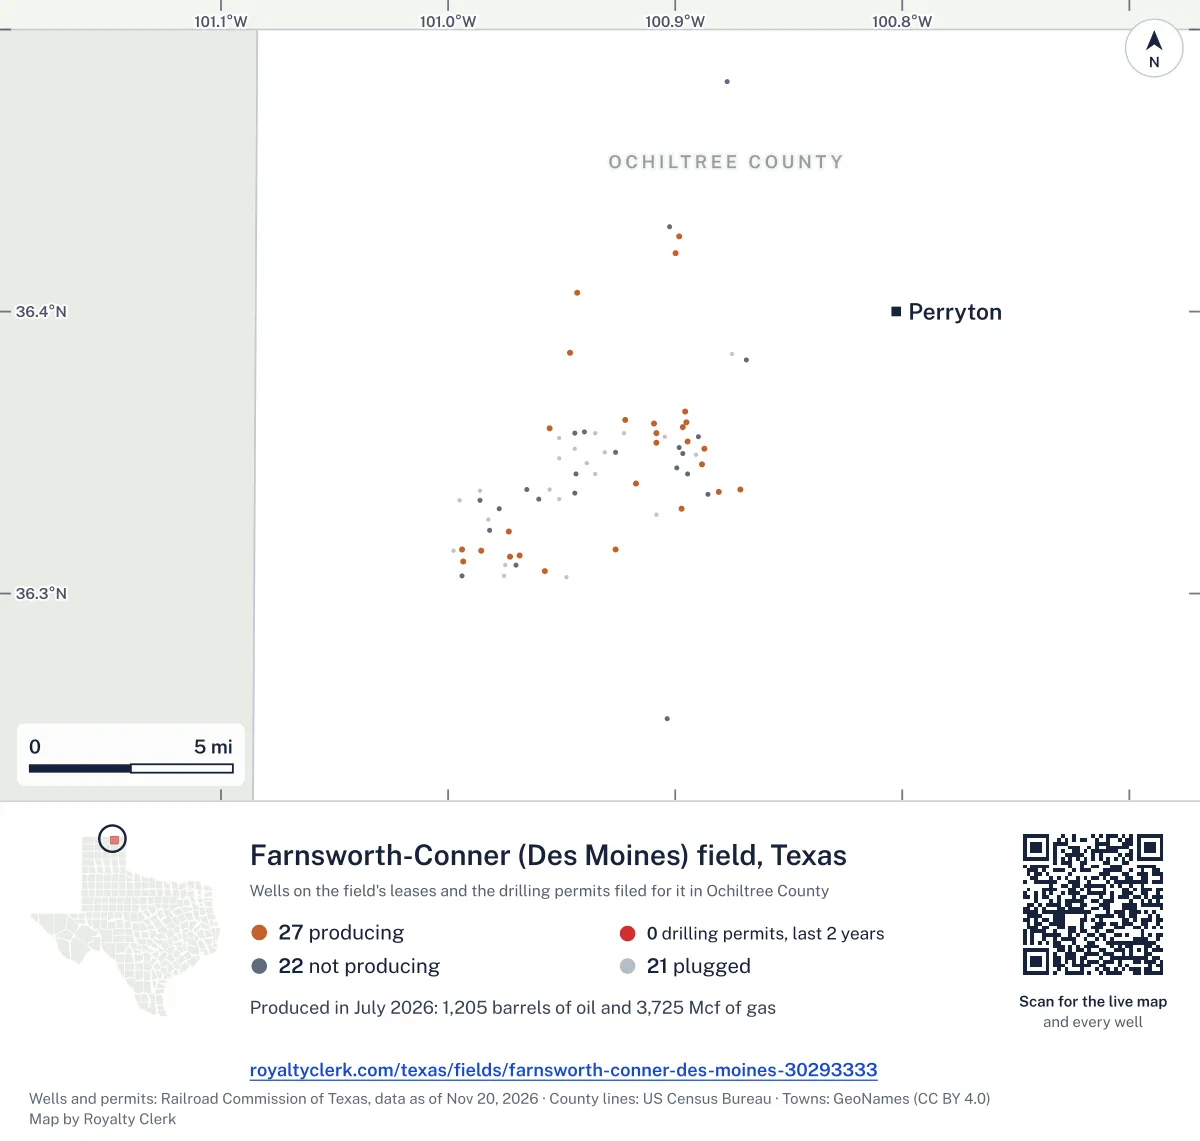
- Drilling locations0Permits issued in the last two years
- Producing wells27On a lease reporting production now
- Not producing22Shut in, inactive or no lease on record
- Plugged21The state's wellbore record says plugged
Each dot is a well on a lease the Railroad Commission lists in the Farnsworth-Conner (Des Moines) field, where its map puts it, or a drilling permit filed for the field in the last 24 months. Wells of other fields are not on this map. The picture is about 29 miles across. The white counties are the ones with a well or drilling permit of the field on the map. Sources: Railroad Commission of Texas well layers and drilling permit files, US Census Bureau county outlines, town points from GeoNames (CC BY 4.0).
Use this map on your site
You may show this map on any site, unchanged. Keep the credit line and its link to Royalty Clerk under the map. The picture updates by itself as the state records new wells and permits.
<a href="https://royaltyclerk.com/texas/fields/farnsworth-conner-des-moines-30293333"><img src="https://royaltyclerk.com/maps/field-wells/farnsworth-conner-des-moines-30293333.svg" alt="Map of the wells of the Farnsworth-Conner (Des Moines) field, Texas: 70 wells and 0 recent drilling locations, in a picture about 29 miles across." width="1000" height="951" loading="lazy" style="max-width:100%;height:auto;border:0"></a>
<p style="margin:4px 0 0;font-size:14px">Map: <a href="https://royaltyclerk.com/texas/fields/farnsworth-conner-des-moines-30293333">Oil and gas wells of the Farnsworth-Conner (Des Moines) field, Texas</a> by Royalty Clerk, from Railroad Commission of Texas records</p>
Oil has led gas in every full year from 1993 to 2025
Farnsworth-Conner (Des Moines) is an oil field in Ochiltree County, with 36 leases on record. Oil made more of its output than gas in every full calendar year from 1993 to 2025.
Operators have changed over the years. Oringderff, Alma Oil Properties filed the first report on four leases from 2000 to 2009, and Upland Resources LLC filed the first report on one lease from 2010 to 2019. No lease started here in 2020 or later. Leases reporting fell from 35 in 2019 to 22 in 2020.
Carson Buckles Exploration LLC now has the largest share of the field, at 27.0%. Its lease Bennett "B" is the oldest producing lease, with reports back to January 1993. No well here is horizontal: 0 of 35 wells.
Not a forecast, not reserves.
Key moments
- 1994Most full calendar year: 84,600 bbl oil and 379,548 mcf gas.
- 2008Oil reaches 81,765 bbl, up from 50,958 bbl in 2007.
- 2013Oil falls to 29,444 bbl, and 39 leases report.
- 2020Leases reporting fall to 22, from 35 in 2019.
- 2023Oil rises to 22,641 bbl, after 15,141 bbl in 2022.
- 202517,226 bbl oil and 48,636 mcf gas; 18 leases report.
If you own here
- Mineral interest finder
Leases here are in Ochiltree County; search a name on county mineral rolls to find accounts and leases.
- Find the land on my deed
The field has 35 wells on producing leases; find where your land sits on the survey map.
- Royalty calculator
18 leases report here now; the calculator estimates a check from volume, price and decimal.
Questions owners ask
- Why do fewer leases report here now?
- Leases reporting fell to 22 in 2020, from 35 in 2019. Four leases stopped in 2020 or later, and no lease started here in 2020 or later. Carson Buckles Exploration LLC runs three producing leases now.
- Who runs the leases in this field now?
- Carson Buckles Exploration LLC has the largest share, 27.0% of the field's output in barrels of oil equivalent. High River Res Operating, LLC follows at 19.8%, and Hunter Oil Corporation at 16.7%. Ten operators are on the field's reports.
- Does this field have horizontal wells?
- No. The field has 35 wells on producing leases, and none of them is horizontal. Oil made more of the field's output than gas in every full calendar year from 1993 to 2025.
- Which lease here is the oldest, and who runs it?
- Bennett "B", lease number 05030, is the oldest producing lease in this field. Its first report is from January 1993. Carson Buckles Exploration LLC is its operator. Compare the lease number on your papers with this one. Mineral interest finder
- How many leases here have stopped?
- The state shows 35 leases stopped before 2020. Four more stopped in 2020 or later. Ten leases that reported from January 1993 still produce.
Related pages
- Carson Buckles Exploration LLC
Runs three producing leases here and holds the largest share, 27.0%.
- High River Res Operating, LLC
Second-largest share here at 19.8% of the field's output.
- Hunter Oil Corporation
Runs one producing lease here, with 16.7% of the field's output.
- Ochiltree County
The county where all 36 leases in this field are on record.
- Bennett "B"
The oldest producing lease here, with reports back to January 1993.
From the state's records through July 2026.
How much oil and gas this field has made lately
Oil output in the Farnsworth-Conner (Des Moines) field fell 17% over the last 12 months
15.1k bbl through Jul 2026, against 18.2k bbl a year earlier. Peak May 2023: 2,497 bbl.
Gas output in the Farnsworth-Conner (Des Moines) field fell 8% over the last 12 months
46.1k mcf through Jul 2026, against 50.2k mcf a year earlier. Peak Dec 2021: 5,375 mcf.
SourceTexas Railroad Commission Production Data Query, field 30293333, through Jul 2026, file dated Oct 20, 2026.
Which leases here report now, and which stopped
Under each volume: change on the year before.
5,050bbl oil−32%
3,103bbl oil+3%
1,014bbl oil−10%
939bbl oiln/a
882bbl oil−3%
794bbl oil−4%
498bbl oil−5%
487bbl oil+63%
412bbl oil+21%
345bbl oil0%
340bbl oil−17%
211bbl oil+50%
191bbl oil−22%
185bbl oil+24%
158bbl oil−61%
109bbl oil−58%
3bbl oil−80%
2bbl oil−100%
Showing 18 of 18, ranked by output value.
SourceTexas Railroad Commission Production Data Query.
Who runs the leases here, and in which county
Operators, by oil
Carson Buckles Exploration leads
- Carson Buckles Exploration LLC3 leases5,055bbl
- High River Res Operating, LLC2 leases3,985bbl
- Courson Oil & Gas, Inc.3 leases1,637bbl
- Hunter Oil Corporation1 lease1,014bbl
- Rig Petroleum, LLC1 lease939bbl
- Bracken Operating, L.L.C.3 leases732bbl
- Batton Oil & Gas, LLC2 leases645bbl
- Upland Resources LLC1 lease340bbl
Recent drilling permits for this field
No recent permits.