
RRC field 53869270 · District 10
Lipscomb (Cleveland)
The Lipscomb (Cleveland) field reported 948,101 barrels of oil and 18 million mcf of gas in the last 12 months.
Field dossier
- Producing leases
- 801of 1,216 on record
- Operators
- 32
- Counties
- 4
- Biggest operator
- Mewbourne Oil Company
Own minerals in this field?
A family member owned minerals here?
Search their name: a family member who owned minerals hereWhere the field sits
fewermore
- Gas, last 12 months
- 17,746,176 mcf
- Data through
- Aug 2026
Wells in the Lipscomb (Cleveland) field

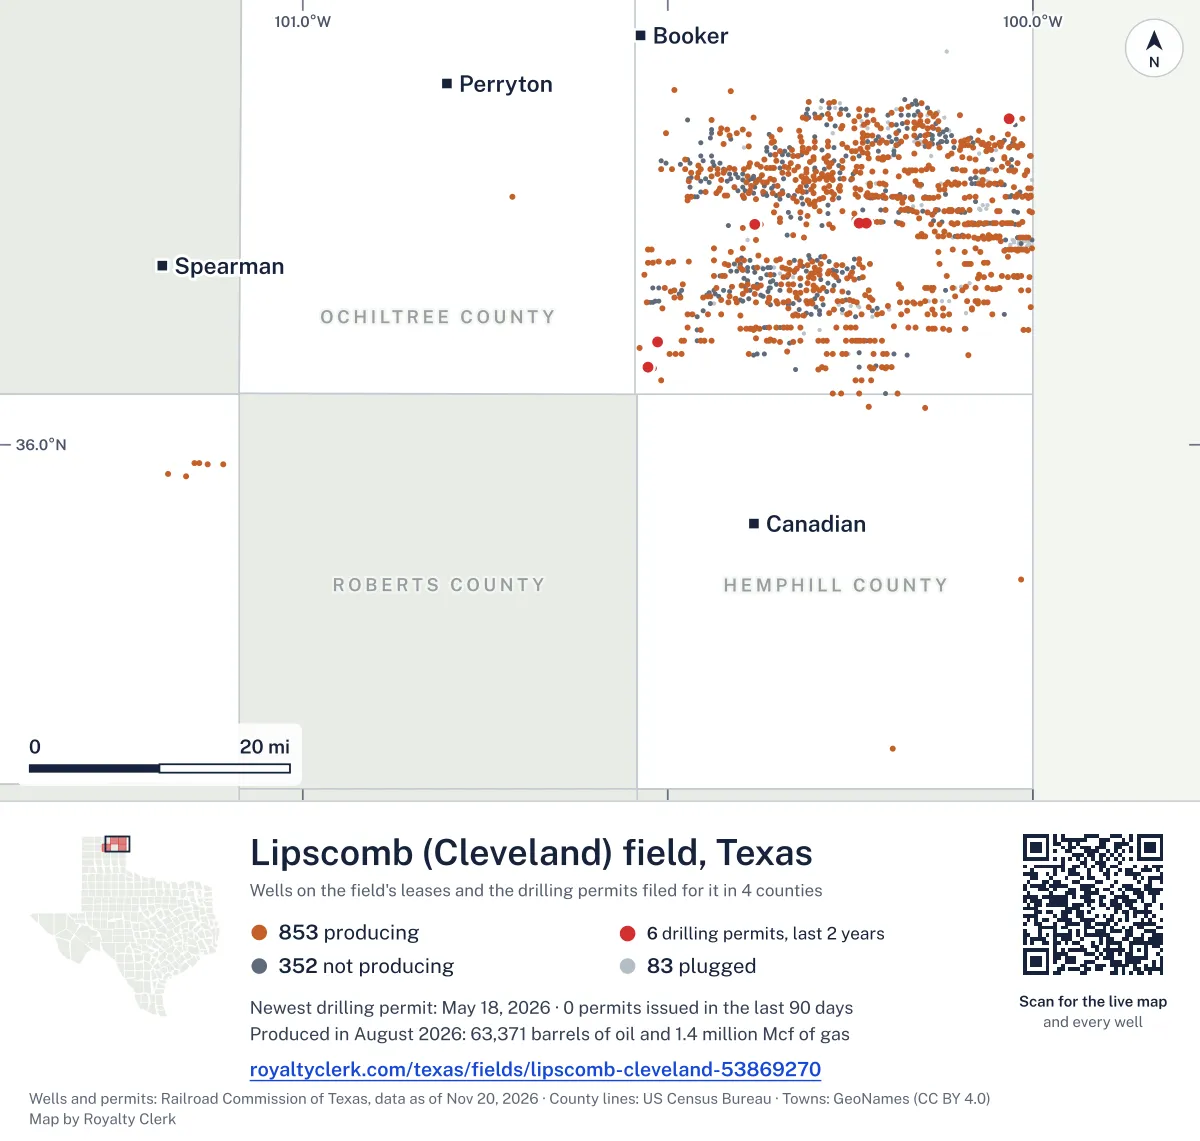
- Drilling locations7Permits issued in the last two years
- Producing wells853On a lease reporting production now
- Not producing352Shut in, inactive or no lease on record
- Plugged83The state's wellbore record says plugged
Each dot is a well on a lease the Railroad Commission lists in the Lipscomb (Cleveland) field, where its map puts it, or a drilling permit filed for the field in the last 24 months. Wells of other fields are not on this map. The picture is about 92 miles across. The white counties are the ones with a well or drilling permit of the field on the map. Sources: Railroad Commission of Texas well layers and drilling permit files, US Census Bureau county outlines, town points from GeoNames (CC BY 4.0).
Use this map on your site
You may show this map on any site, unchanged. Keep the credit line and its link to Royalty Clerk under the map. The picture updates by itself as the state records new wells and permits.
<a href="https://royaltyclerk.com/texas/fields/lipscomb-cleveland-53869270"><img src="https://royaltyclerk.com/maps/field-wells/lipscomb-cleveland-53869270.svg" alt="Map of the wells of the Lipscomb (Cleveland) field, Texas: 1,288 wells and 7 recent drilling locations, in a picture about 92 miles across." width="1000" height="951" loading="lazy" style="max-width:100%;height:auto;border:0"></a>
<p style="margin:4px 0 0;font-size:14px">Map: <a href="https://royaltyclerk.com/texas/fields/lipscomb-cleveland-53869270">Oil and gas wells of the Lipscomb (Cleveland) field, Texas</a> by Royalty Clerk, from Railroad Commission of Texas records</p>
Gas has led this field from 1993 to 2025
Gas made more of the output of Lipscomb (Cleveland) than oil in every full calendar year from 1993 to 2025. The biggest full calendar year was 2012, with 3,066,507 barrels of oil and 47,075,779 mcf of gas. In 2020 the leases reporting here fell from 1,209 in 2019 to 479. Another 72 leases stopped reporting from 2020 on. Mewbourne Oil Company, with 30.3% of field output, runs 165 producing leases here and 11 leases that first reported in 2020 or later. Two drilling permits were filed in the last 12 months, and both are horizontal.
Not a forecast, not reserves.
Key moments
- 2008Oil output reaches 1,143,522 barrels, up from 698,546 in 2007.
- 2012Biggest full calendar year: 3,066,507 barrels of oil, 47,075,779 mcf of gas.
- 2016Oil output falls to 1,690,294 barrels from 2,570,298 in 2015.
- 2020Leases reporting fall from 1,209 in 2019 to 479 in 2020.
- 2025Full year 2025: 936,227 barrels of oil and 18,408,492 mcf of gas.
If you own here
- Gas royalty calculator
Gas made more of this field's output than oil in every full calendar year from 1993 to 2025.
- Royalty calculator
Mewbourne Oil Company, with 30.3% of field output, runs 165 producing leases here. Estimates your check from volume, price and decimal.
- Find the land on my deed
Four counties hold this field, and Lipscomb County has 788 producing leases. Finds the survey or abstract on the map.
Questions owners ask
- How many leases stopped reporting here after 2020?
- 72 leases stopped reporting from 2020 on. Leases reporting here fell from 1,209 in 2019 to 479 in 2020. 17 leases first reported in 2020 or later. The state shows the count of leases reporting each year back to January 1993.
- Who operates the most of this field now?
- Mewbourne Oil Company has the largest share, 30.3% of field output in barrels of oil equivalent. Be Anadarko II, LLC has 17.5%, and Duncan Oil Properties, Inc. has 15.3%. The field has 32 operators in all.
- Which lease in this field is the oldest?
- Piper, Ola O., lease 088326, is the oldest producing lease in this field. Highmark Energy Operating, LLC is its operator. Its first monthly report is for January 1993. Find the land on my deed
- How many wells here are horizontal?
- 606 of the 876 wells on producing leases are horizontal. That is 69.2% of the wells. The field has 801 producing leases and 721 gas wells.
Related pages
- Mewbourne Oil Company
Holds 30.3% of this field's output and 165 producing leases here.
- Be Anadarko II, LLC
Has 17.5% of field output and 148 producing leases here.
- Latigo Petroleum, LLC
Runs 255 producing leases here, with 12.6% of field output.
- Lipscomb County
Holds 788 producing leases, the most of the four counties here.
- Piper, Ola O.
Oldest producing lease in this field, first monthly report January 1993.
From the state's records through July 2026.
Oil and gas by month over the last five years
Oil output in the Lipscomb (Cleveland) field rose 8% over the last 12 months
948k bbl through Aug 2026, against 878k bbl a year earlier. Peak Dec 2025: 97.5k bbl.
Gas output in the Lipscomb (Cleveland) field fell 3% over the last 12 months
18M mcf through Aug 2026, against 18M mcf a year earlier. Peak May 2025: 1.7M mcf.
SourceTexas Railroad Commission Production Data Query, field 53869270, through Aug 2026, file dated Oct 20, 2026.
Which leases here are oldest and newest
Under each volume: change on the year before.
71,064bbl oiln/a
60,836bbl oil−40%
52,102bbl oiln/a
22,171bbl oil−50%
379,620mcf gasn/a
365,571mcf gasn/a
353,372mcf gasn/a
10,737bbl oil−8%
9,030bbl oil−2%
8,551bbl oil−3%
168,854mcf gas−22%
149,487mcf gas−22%
6,066bbl oil−10%
137,591mcf gas−60%
5,701bbl oil−6%
130,083mcf gas−33%
5,123bbl oil−11%
4,419bbl oil−21%
101,711mcf gas+34%
100,155mcf gas−10%
4,001bbl oil−17%
91,906mcf gas−15%
3,788bbl oil+12%
87,349mcf gas−3%
84,240mcf gas−11%
Showing 25 of 150 (the 150 largest of 801), ranked by output value.
SourceTexas Railroad Commission Production Data Query.
Who runs the leases in this field now
Operators, by oil
Mewbourne Oil leads
- Mewbourne Oil Company165 leases382kbbl
- Be Anadarko II, LLC148 leases172kbbl
- Duncan Oil Properties, Inc.6 leases155kbbl
- Unbridled Resources, LLC44 leases91.9kbbl
- Highmark Energy Operating, LLC63 leases54.6kbbl
- Presidio Petroleum LLC29 leases32.5kbbl
- Latigo Petroleum, LLC255 leases20.9kbbl
- Kaiser-Francis Oil Company1 lease10.7kbbl
Counties, by oil
Lipscomb County leads
Drilling permits in the last 12 months
KELLN 205 #C002AP
new drill · horizontal · Mewbourne Oil Company · Lipscomb County
Permit 0915664 · May 18, 2026
ARLENE #2629H
new drill · horizontal · Duncan Oil Properties, Inc. · Lipscomb County
Permit 0915169 · Apr 29, 2026
ARLENE #1629H
new drill · horizontal · Duncan Oil Properties, Inc. · Lipscomb County
Permit 0908637 · Jul 14, 2025
JOHNSON-KELLN 148/205 A #C001MC
new drill · horizontal · Mewbourne Oil Company · Lipscomb County
Permit 0907878 · May 13, 2025
GOSSETT 967 #C001CN
new drill · horizontal · Mewbourne Oil Company · Lipscomb County
Permit 0907105 · Apr 3, 2025
BOOTH G #3637HX
new drill · horizontal · Duncan Oil Properties, Inc. · Lipscomb County
Permit 0903731 · Nov 25, 2024