
RRC field 57774275 · District 08
Martin (Consolidated)
The Martin (Consolidated) field reported 335,296 barrels of oil and 1.5 million mcf of gas in the last 12 months.
Field dossier
- Producing leases
- 77of 92 on record
- Operators
- 28
- Counties
- 3
- Biggest operator
- Crescent Energy Operating, LLC
Own minerals in this field?
A family member owned minerals here?
Search their name: a family member who owned minerals hereWhere the field sits
fewermore
- Gas, last 12 months
- 1,484,481 mcf
- Data through
- Aug 2026
Wells in the Martin (Consolidated) field

- Drilling locations3Permits issued in the last two years
- Producing wells424On a lease reporting production now
- Not producing16Shut in, inactive or no lease on record
- Plugged39The state's wellbore record says plugged
Each dot is a well on a lease the Railroad Commission lists in the Martin (Consolidated) field, where its map puts it, or a drilling permit filed for the field in the last 24 months. Wells of other fields are not on this map. The picture is about 67 miles across. The white counties are the ones with a well or drilling permit of the field on the map. One more location on record lies far from all the others and is left off the picture. Sources: Railroad Commission of Texas well layers and drilling permit files, US Census Bureau county outlines, town points from GeoNames (CC BY 4.0).
Use this map on your site
You may show this map on any site, unchanged. Keep the credit line and its link to Royalty Clerk under the map. The picture updates by itself as the state records new wells and permits.
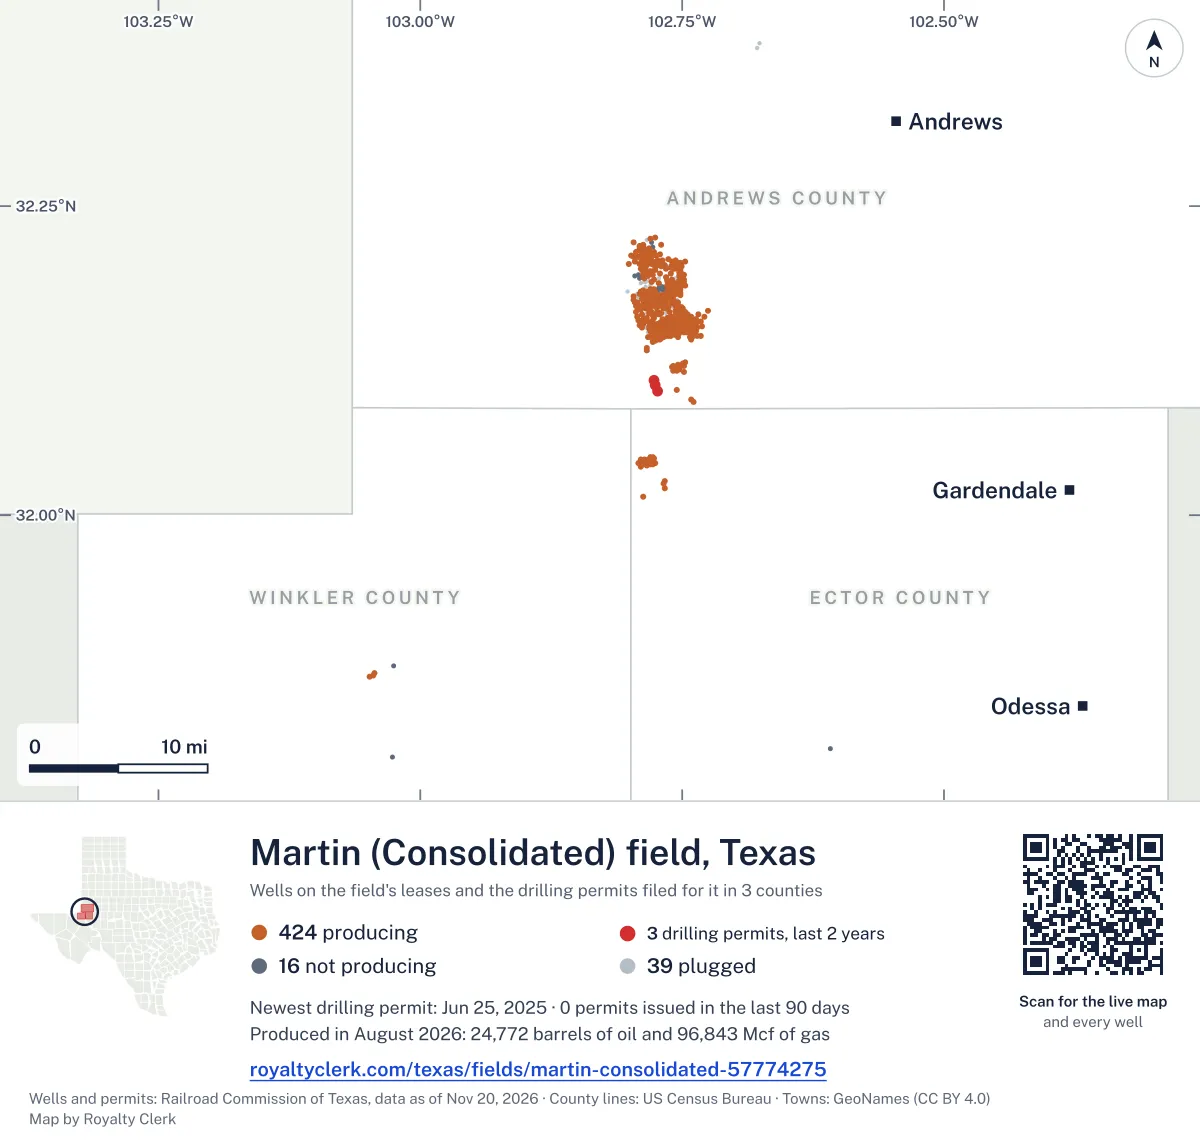
<a href="https://royaltyclerk.com/texas/fields/martin-consolidated-57774275"><img src="https://royaltyclerk.com/maps/field-wells/martin-consolidated-57774275.svg" alt="Map of the wells of the Martin (Consolidated) field, Texas: 479 wells and 3 recent drilling locations, in a picture about 67 miles across." width="1000" height="951" loading="lazy" style="max-width:100%;height:auto;border:0"></a>
<p style="margin:4px 0 0;font-size:14px">Map: <a href="https://royaltyclerk.com/texas/fields/martin-consolidated-57774275">Oil and gas wells of the Martin (Consolidated) field, Texas</a> by Royalty Clerk, from Railroad Commission of Texas records</p>
How Martin (Consolidated) turned from gas to oil in 2010
Martin (Consolidated) is a field of 92 leases in three counties, and oil has made more of its output since 2010. From 1996 to 2009, gas made more, counted in barrels of oil equivalent (boe).
Its biggest full calendar year was 2002, with 734,791 bbl of oil and 7,078,144 mcf of gas. Output has moved up and down since then, with a rise in 2010 and 2011.
Crescent Energy Operating, LLC has 27.7% of the field's boe, and Hilcorp Energy Company has 20.8%. Octane Energy Operating, LLC holds 8 leases that began reporting in 2020 or later. Of 534 wells on producing leases, 3 are horizontal.
Not a forecast, not reserves.
Key moments
- 2002Biggest full calendar year: 734,791 bbl oil, 7,078,144 mcf gas
- 2010Oil passes gas in barrels of oil equivalent; leases reporting rise to 68
- 2014Oil reaches 929,197 bbl with 79 leases reporting
- 2020Leases reporting fall from 83 to 73; newer leases start reporting
If you own here
- Find the land on my deed
Leases here sit in Andrews, Ector and Winkler counties; a deed's survey number finds the land.
- Mineral interest finder
The field has 92 leases in three counties; search your name on county mineral rolls for accounts.
- Royalty calculator
Hilcorp Energy Company runs 11 producing leases here; enter volume and price for an estimated check.
Questions owners ask
- Which operator runs the most of this field now?
- Crescent Energy Operating, LLC runs 12 producing leases here and has 27.7% of the field's boe. Hilcorp Energy Company runs 11 producing leases and has 20.8% of the field's boe.
- Which lease in this field is the oldest one still producing?
- Martin, Nellie C., lease number 36485, is the oldest producing lease here. Unitex Oil & Gas, L.L.C. operates it, and its first monthly report is for December 2000.
- How many of the field's wells are horizontal?
- Of 534 wells on producing leases in this field, 3 are horizontal. That is 0.6% of the wells.
- How do I tell whether my land is in this field?
- Leases in this field sit in Andrews, Ector and Winkler counties. A section, block, survey or abstract number from your deed finds the land on a survey map, with its wells and permits. Find the land on my deed
Related pages
- Crescent Energy Operating, LLC
Holds the largest share of the field's boe, from 12 producing leases.
- Hilcorp Energy Company
Runs 11 producing leases here; 20.8% of the field's boe.
- Octane Energy Operating, LLC
Holds 8 leases new since 2020 and 13 producing leases here.
- Andrews County
Where most of this field's producing leases lie.
- Martin, Nellie C.
The oldest producing lease here, first report December 2000.
From the state's records through July 2026.
How much oil and gas has this field made each year?
Oil output in the Martin (Consolidated) field fell 3% over the last 12 months
335k bbl through Aug 2026, against 347k bbl a year earlier. Peak Sep 2021: 44.5k bbl.
Gas output in the Martin (Consolidated) field held steady over the last 12 months
1.5M mcf through Aug 2026, against 1.5M mcf a year earlier. Peak Oct 2021: 201k mcf.
SourceTexas Railroad Commission Production Data Query, field 57774275, through Aug 2026, file dated Oct 20, 2026.
Which leases in this field are old, and which are new?
Under each volume: change on the year before.
25,815bbl oil−12%
22,007bbl oil−6%
16,051bbl oil+1%
14,275bbl oil+18%
13,850bbl oil−11%
13,159bbl oil−16%
12,795bbl oil+9%
12,755bbl oil−23%
12,056bbl oil−16%
9,848bbl oiln/a
9,401bbl oil+3%
9,106bbl oil−4%
8,643bbl oil−17%
8,516bbl oil+12%
6,982bbl oil+4%
6,909bbl oil−16%
6,405bbl oil−17%
6,320bbl oil+2%
6,315bbl oil−16%
5,974bbl oil+44%
4,777bbl oil−3%
4,725bbl oil−38%
4,687bbl oil+4%
4,627bbl oil−1%
4,327bbl oil−17%
Showing 25 of 77, ranked by output value.
SourceTexas Railroad Commission Production Data Query.
Who operates the field, and in which counties?
Operators, by oil
Crescent Energy Operating leads
- Crescent Energy Operating, LLC12 leases92.2kbbl
- Octane Energy Operating, LLC13 leases60.7kbbl
- Hilcorp Energy Company11 leases40kbbl
- Discovery Operating, Inc.5 leases32.6kbbl
- Unitex Oil & Gas, L.L.C.4 leases32.6kbbl
- Bce-Mach III LLC1 lease12.1kbbl
- Winn Operating, LLC3 leases10.7kbbl
- BCP Resources, LLC2 leases10.2kbbl
Counties, by oil
Andrews County leads
What drilling permits has this field had recently?
UNIVERSITY GENESIS 34 #1001
re-entry · Comal Operating LLC · Andrews County
Permit 0908819 · Jun 25, 2025
UNIVERSITY GENESIS 34 #1002W
re-entry · Comal Operating LLC · Andrews County
Permit 0908818 · Jun 24, 2025
UNIVERSITY GENESIS 34 #1004
re-entry · Comal Operating LLC · Andrews County
Permit 0907954 · May 19, 2025
R.B. -AB- COWDEN #8C
recompletion · Fivestones Energy LLC · Ector County
Permit 0899729 · May 22, 2024
R.B. -AB- COWDEN #4
recompletion · Fivestones Energy LLC · Ector County
Permit 0899377 · May 6, 2024
CUMMINS -K- #24
recompletion · Fivestones Energy LLC · Ector County
Permit 0898804 · Apr 16, 2024