
RRC field 62528001 · District 09
Montague County Regular
The Montague County Regular field reported 293,964 barrels of oil and 33,555 mcf of gas in the last 12 months.
Field dossier
- Producing leases
- 174of 214 on record
- Operators
- 50
- Counties
- 1
- Biggest operator
- Peba Oil & Gas, Inc.
Own minerals in this field?
A family member owned minerals here?
Search their name: a family member who owned minerals hereWhere the field sits
This county
- Gas, last 12 months
- 33,555 mcf
- Data through
- Jul 2026
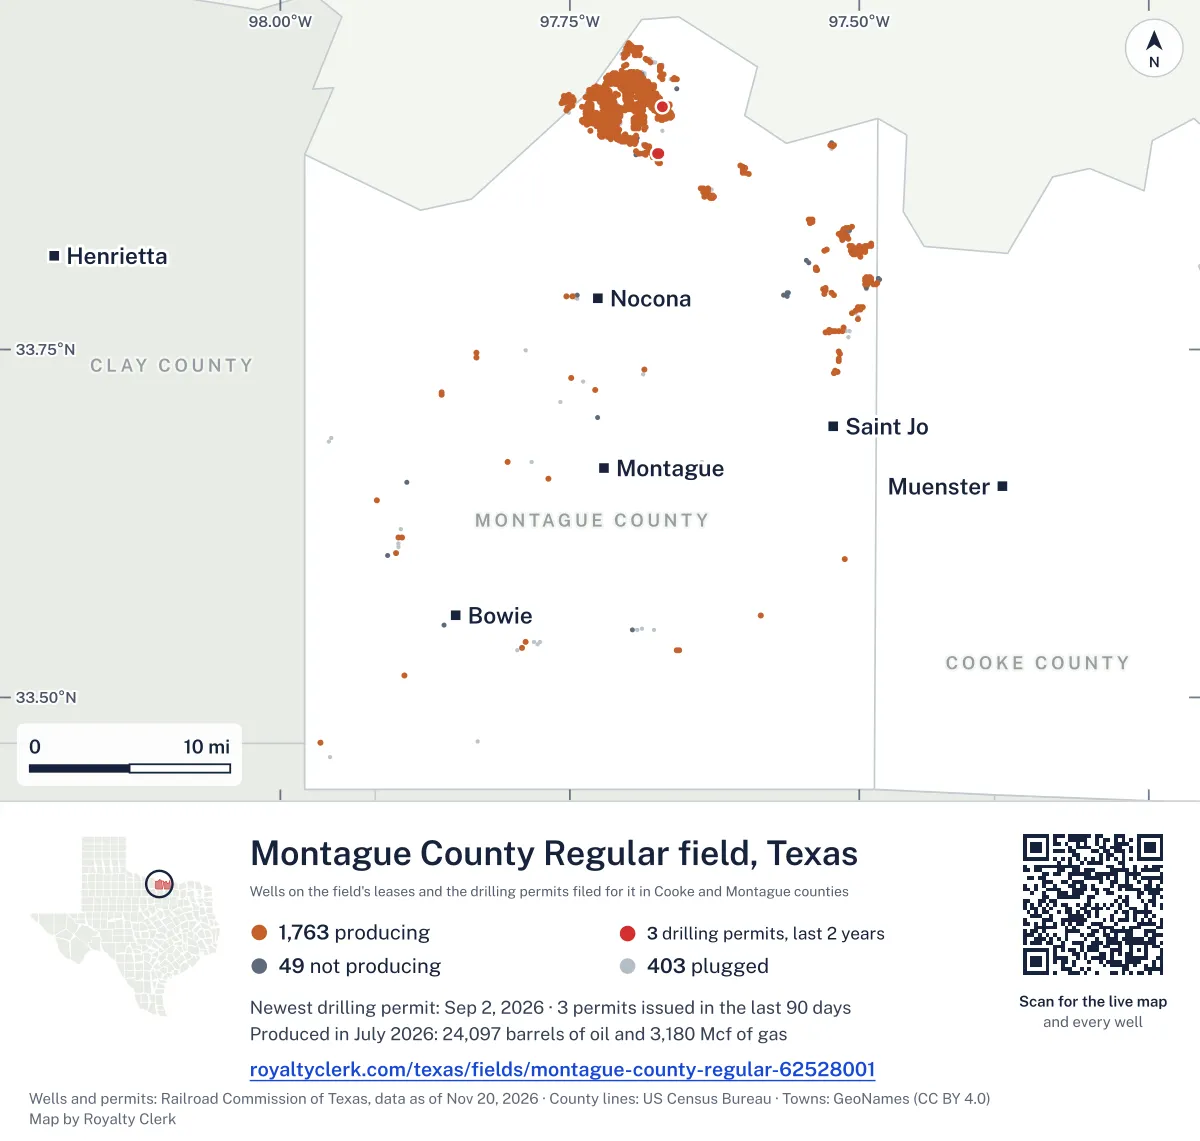
Wells in the Montague County Regular field

- Drilling locations3Permits issued in the last two years
- Producing wells1,763On a lease reporting production now
- Not producing49Shut in, inactive or no lease on record
- Plugged403The state's wellbore record says plugged
Each dot is a well on a lease the Railroad Commission lists in the Montague County Regular field, where its map puts it, or a drilling permit filed for the field in the last 24 months. Wells of other fields are not on this map. The picture is about 60 miles across. The white counties are the ones with a well or drilling permit of the field on the map. 25 more wells have no location on the state's map. Sources: Railroad Commission of Texas well layers and drilling permit files, US Census Bureau county outlines, town points from GeoNames (CC BY 4.0).
Use this map on your site
You may show this map on any site, unchanged. Keep the credit line and its link to Royalty Clerk under the map. The picture updates by itself as the state records new wells and permits.
<a href="https://royaltyclerk.com/texas/fields/montague-county-regular-62528001"><img src="https://royaltyclerk.com/maps/field-wells/montague-county-regular-62528001.svg" alt="Map of the wells of the Montague County Regular field, Texas: 2,215 wells and 3 recent drilling locations, in a picture about 60 miles across." width="1000" height="951" loading="lazy" style="max-width:100%;height:auto;border:0"></a>
<p style="margin:4px 0 0;font-size:14px">Map: <a href="https://royaltyclerk.com/texas/fields/montague-county-regular-62528001">Oil and gas wells of the Montague County Regular field, Texas</a> by Royalty Clerk, from Railroad Commission of Texas records</p>
How this field's leases and output changed after 2001
Montague County Regular is a field of 214 leases in Montague County, and oil has made more of its output than gas in every full calendar year from 1993 to 2025.
Leases have thinned since then. Leases reporting fell to 178 in 2020, from 212 in 2019, and 76 leases stopped before 2020. Gas output has fallen too: 59,786 mcf in 2003, from 95,854 mcf in 2001.
Peba Oil & Gas, Inc. now has the largest share of the field's output, at 32.9%. Only three leases are new since 2020, and one horizontal well stands among 2,565 wells on producing leases.
Not a forecast, not reserves.
Key moments
- 1993Patrick & Hadley led with 18 leases on the record
- 2001Biggest full calendar year: 741,727 bbl of oil, 95,854 mcf of gas
- 2003Gas output drops to 59,786 mcf, from 95,854 mcf in 2001
- 2020Leases reporting fell to 178, from 212 in 2019
- 2025Last full calendar year: 179 leases reported production
If you own here
- Find the land on my deed
Montague County Regular has 214 leases; find your survey or abstract number to see its wells and permits.
- Mineral interest finder
Only Montague County holds this field; search your name on its mineral rolls for accounts and leases.
Questions owners ask
- Who runs the leases in this field now?
- Peba Oil & Gas, Inc. has the largest share of the field's output, 32.9%, and runs 15 producing leases. V & H Oil, L.P. runs 17 producing leases and has a 15.0% share of output.
- How do I find my lease in this field?
- The field lists 214 leases, and 174 are producing now. Look up your lease by its survey, abstract or lease number to see its operator and wells. Find the land on my deed
- How many leases here are new, and how many have stopped?
- Three leases first reported in 2020 or later. Twelve leases stopped in 2020 or later. The oldest producing lease, Howard, N. J. -Abc- lease 04153, has reported from January 1993.
Related pages
- Peba Oil & Gas, Inc.
Largest share of this field's output, with 15 producing leases here.
- V & H Oil, L.P.
Runs 17 producing leases here, with a 15.0% share of output.
- Hadley Oil Company, LLC
Runs 19 producing leases in this field, the most of the top operators.
- Howard, N. J. -Abc-
Oldest producing lease here, reporting back to January 1993.
From the state's records through July 2026.
How oil and gas output moved over the last five years
Oil output in the Montague County Regular field fell 3% over the last 12 months
294k bbl through Jul 2026, against 304k bbl a year earlier. Peak May 2022: 28.7k bbl.
Gas output in the Montague County Regular field fell 5% over the last 12 months
33.6k mcf through Jul 2026, against 35.3k mcf a year earlier. Peak May 2023: 4,079 mcf.
SourceTexas Railroad Commission Production Data Query, field 62528001, through Jul 2026, file dated Oct 20, 2026.
Which leases are here, and which have stopped
Under each volume: change on the year before.
34,821bbl oil−1%
20,088bbl oil+3%
17,339bbl oil−3%
16,076bbl oil−3%
13,851bbl oil−1%
7,499bbl oil−3%
7,129bbl oil−6%
6,745bbl oil0%
6,133bbl oil−7%
5,941bbl oil−7%
4,971bbl oil−8%
4,527bbl oil−1%
4,272bbl oil−1%
4,194bbl oil−10%
4,137bbl oil+26%
4,107bbl oil−13%
3,503bbl oil+5%
3,451bbl oil−9%
3,355bbl oil−2%
3,295bbl oil−16%
3,189bbl oil+7%
3,170bbl oil+1%
3,017bbl oil−8%
2,786bbl oil+6%
2,604bbl oil−8%
Showing 25 of 150 (the 150 largest of 174), ranked by output value.
SourceTexas Railroad Commission Production Data Query.
Who runs the leases in this field now
Operators, by oil
Peba Oil & Gas leads
Recent drilling permits for Montague County Regular
SALMON D & E #33D
new drill · V & H Oil, L.P. · Montague County
Permit 0918221 · Sep 2, 2026
SALMON D & E #54E
new drill · V & H Oil, L.P. · Montague County
Permit 0918066 · Aug 31, 2026
SALMON D & E #53E
new drill · V & H Oil, L.P. · Montague County
Permit 0918064 · Aug 31, 2026
DENSON UNIT #4
new drill · Quail Ridge Operating LLC · Montague County
Permit 0897707 · Mar 6, 2024
GILBERT UNIT #4
new drill · Quail Ridge Operating LLC · Montague County
Permit 0897708 · Mar 1, 2024
HAHN #2
new drill · Extech Operating, LLC · Montague County
Permit 0894291 · Oct 11, 2023