
RRC field 89812001 · District 7B
Throckmorton County Regular
The Throckmorton County Regular field reported 142,723 barrels of oil and 135,643 mcf of gas in the last 12 months.
Field dossier
- Producing leases
- 132of 232 on record
- Operators
- 44
- Counties
- 1
- Biggest operator
- Subsea Operating Co.
Own minerals in this field?
A family member owned minerals here?
Search their name: a family member who owned minerals hereWhere the field sits
This county
- Gas, last 12 months
- 135,643 mcf
- Data through
- Jul 2026
Wells in the Throckmorton County Regular field

- Drilling locations14Permits issued in the last two years
- Producing wells545On a lease reporting production now
- Not producing136Shut in, inactive or no lease on record
- Plugged255The state's wellbore record says plugged
Each dot is a well on a lease the Railroad Commission lists in the Throckmorton County Regular field, where its map puts it, or a drilling permit filed for the field in the last 24 months. Wells of other fields are not on this map. The picture is about 161 miles across. The white counties are the ones with a well or drilling permit of the field on the map. Six more wells have no location on the state's map. Sources: Railroad Commission of Texas well layers and drilling permit files, US Census Bureau county outlines, town points from GeoNames (CC BY 4.0).
Use this map on your site
You may show this map on any site, unchanged. Keep the credit line and its link to Royalty Clerk under the map. The picture updates by itself as the state records new wells and permits.
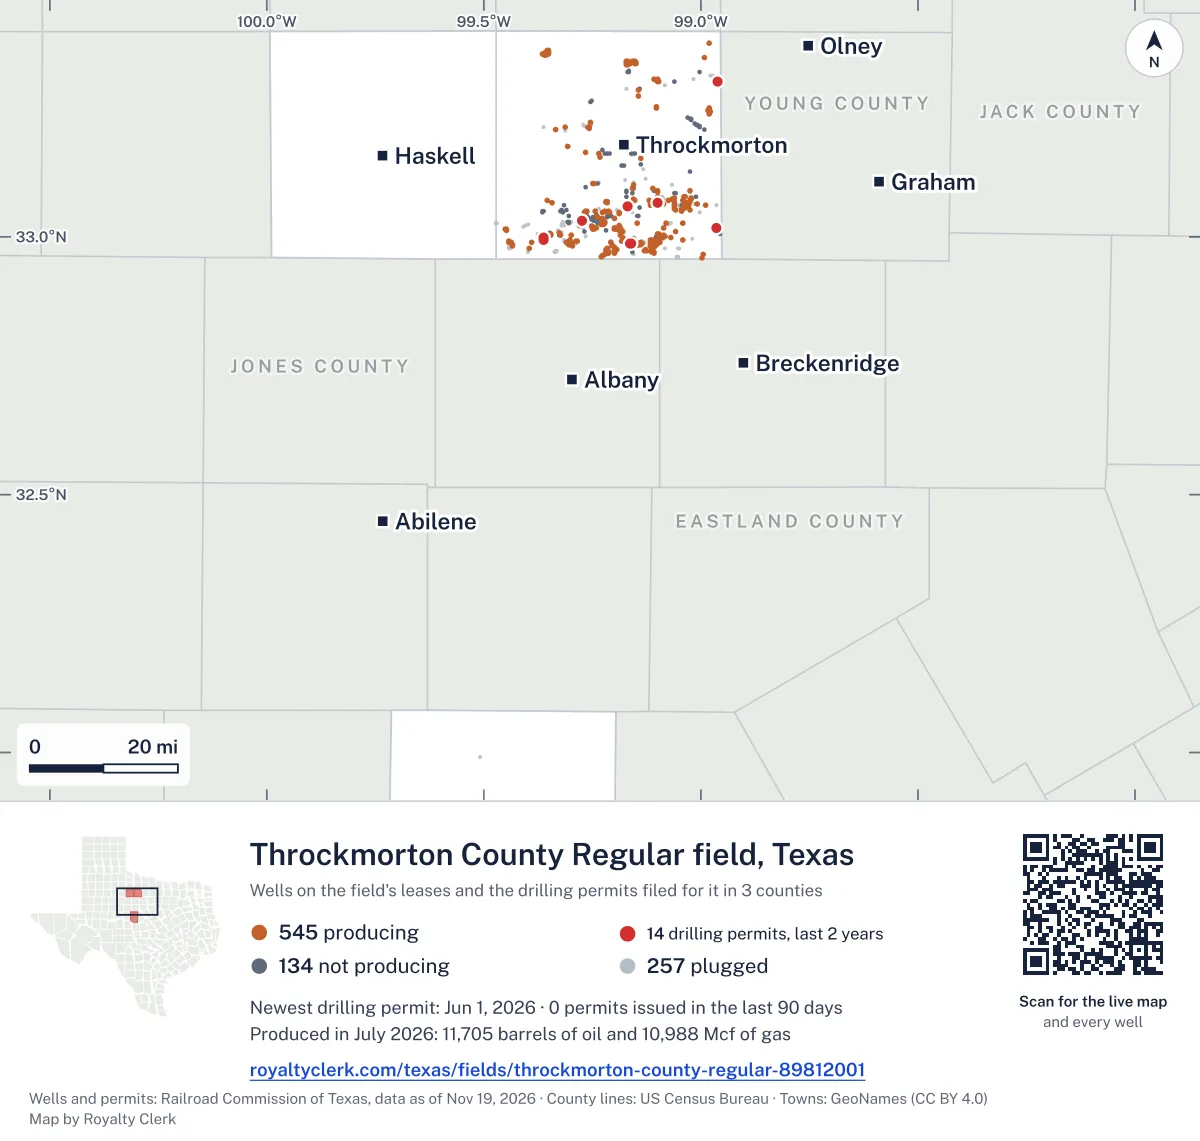
<a href="https://royaltyclerk.com/texas/fields/throckmorton-county-regular-89812001"><img src="https://royaltyclerk.com/maps/field-wells/throckmorton-county-regular-89812001.svg" alt="Map of the wells of the Throckmorton County Regular field, Texas: 936 wells and 14 recent drilling locations, in a picture about 161 miles across." width="1000" height="951" loading="lazy" style="max-width:100%;height:auto;border:0"></a>
<p style="margin:4px 0 0;font-size:14px">Map: <a href="https://royaltyclerk.com/texas/fields/throckmorton-county-regular-89812001">Oil and gas wells of the Throckmorton County Regular field, Texas</a> by Royalty Clerk, from Railroad Commission of Texas records</p>
Who built this field, and what changed in 2020
Throckmorton County Regular is a field of 232 leases, and 132 of them are producing now. Its biggest full calendar year was 1993, with 559,121 barrels of oil. Oil made more of the field's output than gas in every full calendar year from 1993 to 2025.
Jacobs, C. E., Co. had 34 leases on the record in January 1993. Cottonwood Petroleum Co. first reported 32 leases from 1993 to 1999. Later, Goopco, Inc., Antle Operating, Inc. and Stovall Operating Co. took the first reports on new leases from 2010 to 2019.
Leases reporting fell from 223 in 2019 to 164 in 2020, and 45 leases have stopped since 2020. Subsea Operating Co. and S.b. Street Operating, Inc. now lead, with 14.3% and 13.8% of the field's output.
Not a forecast, not reserves.
Key moments
- 1993Jacobs, C. E., Co. holds 34 leases; the field's biggest full calendar year
- 2000Cottonwood Petroleum first reports 20 leases from 2000 to 2009
- 2020Leases reporting fell from 223 to 164 as 45 leases stopped
- 2025128 leases report in 2025, down from 369 in 1993
If you own here
- Find the land on my deed
The field has 5 drilling permits in the last 12 months. A survey or abstract number finds which permits sit on your land.
- Royalty calculator
The field has 132 producing leases and 142,723 barrels of oil in the last 12 months. The tool turns volume and price into an estimated check.
Questions owners ask
- Who runs this field now?
- Subsea Operating Co. has 14.3% of the field's output, counted in barrels of oil equivalent. S.b. Street Operating, Inc. has 13.8% and runs 13 producing leases. Petex has 9.3%. The field has 44 operators in all.
- What happened to the field after 2019?
- Leases reporting fell from 223 in 2019 to 164 in 2020. Since 2020, 9 leases have started and 45 have stopped. Subsea, S.b. Street and Petex now lead the field's output.
- How much oil and gas did this field make in the last 12 months?
- The field made 142,723 barrels of oil and 135,643 mcf of gas in the last 12 months. Its biggest full calendar year was 1993, with 559,121 barrels of oil and 451,254 mcf of gas. Royalty calculator
- Are the wells here horizontal, and are new permits filed?
- The field has 819 wells on its producing leases, and none are horizontal. Operators filed 5 drilling permits in the last 12 months, and none of them are horizontal. Find the land on my deed
Related pages
- Matthews Pa
The oldest producing lease here, with its first report in January 1993.
- Subsea Operating Co.
Runs 2 producing leases here, with 14.3% of the field's output.
- S.b. Street Operating, Inc.
Runs 13 producing leases here, with 13.8% of the field's output.
From the state's records through July 2026.
How oil and gas ran over the last five years
Oil output in the Throckmorton County Regular field fell 7% over the last 12 months
143k bbl through Jul 2026, against 153k bbl a year earlier. Peak Mar 2025: 14.4k bbl.
Gas output in the Throckmorton County Regular field fell 5% over the last 12 months
136k mcf through Jul 2026, against 143k mcf a year earlier. Peak Aug 2022: 18.2k mcf.
SourceTexas Railroad Commission Production Data Query, field 89812001, through Jul 2026, file dated Oct 20, 2026.
Which leases here are producing and when they started
Under each volume: change on the year before.
18,220bbl oil−5%
13,987bbl oil−10%
7,591bbl oil0%
5,255bbl oil−2%
5,252bbl oil−50%
4,350bbl oiln/a
4,158bbl oil−24%
3,805bbl oil+476%
3,679bbl oil−21%
3,415bbl oil−18%
2,515bbl oil−27%
2,216bbl oil+295%
1,965bbl oil+6%
1,775bbl oil−11%
- MATTHEWS
7B-10925PetexThrockmorton County
1,773bbl oil+54%
1,700bbl oil−5%
1,658bbl oil−14%
1,644bbl oil+59%
1,576bbl oil+232%
1,483bbl oil+50%
1,469bbl oil+24%
1,449bbl oil+21%
1,379bbl oil+24%
1,343bbl oil+585%
1,342bbl oil+5%
Showing 25 of 132, ranked by output value.
SourceTexas Railroad Commission Production Data Query.
Who built this field and who runs it now
Operators, by oil
Subsea Operating leads
Which drilling permits were filed here recently
WBRR 233 #113
new drill · Okie Operating Company, Ltd. · Throckmorton County
Permit 0915944 · Jun 1, 2026
WBRR 233 #112
new drill · Okie Operating Company, Ltd. · Throckmorton County
Permit 0914927 · Apr 21, 2026
WHITAKER 1621 #3
field transfer · R & R Oil & Gas, LLC · Throckmorton County
Permit 0911813 · Apr 16, 2026
J. R. MARSHALL #5
re-entry · S.b. Street Operating, Inc. · Throckmorton County
Permit 0913678 · Feb 24, 2026
MATTHEWS QA #11QA
new drill · Petex · Throckmorton County
Permit 0910333 · Sep 23, 2025
MATTHEWS 23 #8
new drill · Subsea Operating Co. · Throckmorton County
Permit 0909020 · Jul 8, 2025