
Texas oil lease
StoppedFASKEN "E"
Fasken "E" is an oil lease in Midland County, Texas, in the Spraberry (Trend Area) field. It stopped producing after October 2024. The last sale was reported in January 2025, after the last oil produced in October 2024; nothing has been reported for 1 year 7 months since. Diamondback E&P LLC was its last operator.
This lease has stopped
The last sale was reported in Jan 2025, after the last oil produced in Oct 2024.
- Last operator
- Diamondback E&P LLC
- County
- Midland County
- RRC lease
- 08-34079
Is your family on this lease?
Where it sits
This county
- Silent for
- 1 year 7 months
- First report
- Dec 1993
Fasken "E", 1993–2026
Its whole life in the Railroad Commission’s monthly reports, which start in January 1993; it first reported in December 1993. The last sale was reported in Jan 2025, after the last oil produced in Oct 2024. Royalty owners and their heirs can still be on the county roll after the checks stop.
- First reportDec 1993
- Best year2014$274,000 sold
- Last operatorDiamondback E&P LLCfrom Jan 2025
- Last oil producedOct 2024
- Last sale reportedJan 2025
- Silent for1 year 7 monthsthrough Aug 2026
- Oil sold since December 1993
- 53,771barrels
- Gas sold since December 1993
- 60,404thousand cubic feet (mcf)
- Sold for, in all
- $2.6 millionat each month's public prices, 100% of the lease
Source: Texas Railroad Commission production reports since January 1993 (oil and gas sold); EIA prices, through August 2026.
Every year as a table
| Year | Months | Oil sold, bbl | Gas sold, mcf | Sold for |
|---|---|---|---|---|
| 2026 * | 0 | 0 | 0 | $0 |
| 2025 | 3 | 21 | 0 | $1,591 |
| 2024 | 12 | 718 | 0 | $57,153 |
| 2023 | 12 | 1,077 | 64 | $87,582 |
| 2022 | 12 | 616 | 98 | $57,785 |
| 2021 | 12 | 526 | 363 | $34,825 |
| 2020 | 12 | 664 | 151 | $25,796 |
| 2019 | 12 | 785 | 204 | $43,197 |
| 2018 | 12 | 312 | 169 | $21,062 |
| 2017 | 12 | 358 | 110 | $18,530 |
| 2016 | 12 | 1,297 | 1,555 | $58,649 |
| 2015 | 12 | 1,561 | 1,550 | $79,201 |
| 2014 | 12 | 2,890 | 2,174 | $274,698 |
| 2013 | 12 | 1,724 | 1,385 | $174,498 |
| 2012 | 12 | 1,346 | 1,942 | $131,534 |
| 2011 | 12 | 2,240 | 2,737 | $223,610 |
| 2010 | 12 | 2,401 | 3,686 | $206,742 |
| 2009 | 12 | 1,580 | 2,749 | $110,167 |
| 2008 | 12 | 950 | 1,128 | $101,472 |
| 2007 | 12 | 725 | 769 | $59,833 |
| 2006 | 12 | 1,538 | 1,428 | $109,325 |
| 2005 | 12 | 706 | 497 | $45,934 |
| 2004 | 12 | 605 | 373 | $27,014 |
| 2003 | 12 | 193 | 317 | $7,617 |
| 2002 | 12 | 1,001 | 2,351 | $31,936 |
| 2001 | 12 | 1,961 | 4,908 | $69,792 |
| 2000 | 12 | 1,353 | 2,615 | $52,099 |
| 1999 | 12 | 1,264 | 1,811 | $28,169 |
| 1998 | 12 | 1,832 | 1,933 | $30,425 |
| 1997 | 12 | 3,007 | 1,828 | $68,883 |
| 1996 | 12 | 6,899 | 6,147 | $164,534 |
| 1995 | 12 | 5,419 | 7,578 | $111,858 |
| 1994 | 12 | 6,202 | 7,783 | $121,662 |
| 1993 | 1 | 0 | 1 | $2 |
* Part of the year: the records run through August 2026.
For families and heirs
What an heir can do next
Search the family name
Type the name from an old check stub, a deed or the will. We search every county roll we hold and the state's records.
Search a nameSee why the checks stopped
Checks stop when a lease stops, when the operator changes, or when an account goes into suspense. See which one the state's records point to.
Check this leaseValue an inherited share
A relative owned a share? See what it earned after they died, month by month, from the state's records.
Start with the estateHear if it starts again
Stopped leases are sometimes reworked or taken over by a new operator. Get an email when this one reports again.
Email me if it restarts
Did a relative own a share of this lease?
Pick the year they passed and see what the lease has sold since.
Checks stopped on this lease?
- Operator
Operator changed: Diamondback E&P LLC took over from Endeavor Energy Resources L.P. in Jan 2025.
- Wells
The one well on this lease is marked plugged.
SourceRailroad Commission production, P-5 and P-4 records, data through Aug 2026.
See why checks stop on this leaseWells on this lease and around it
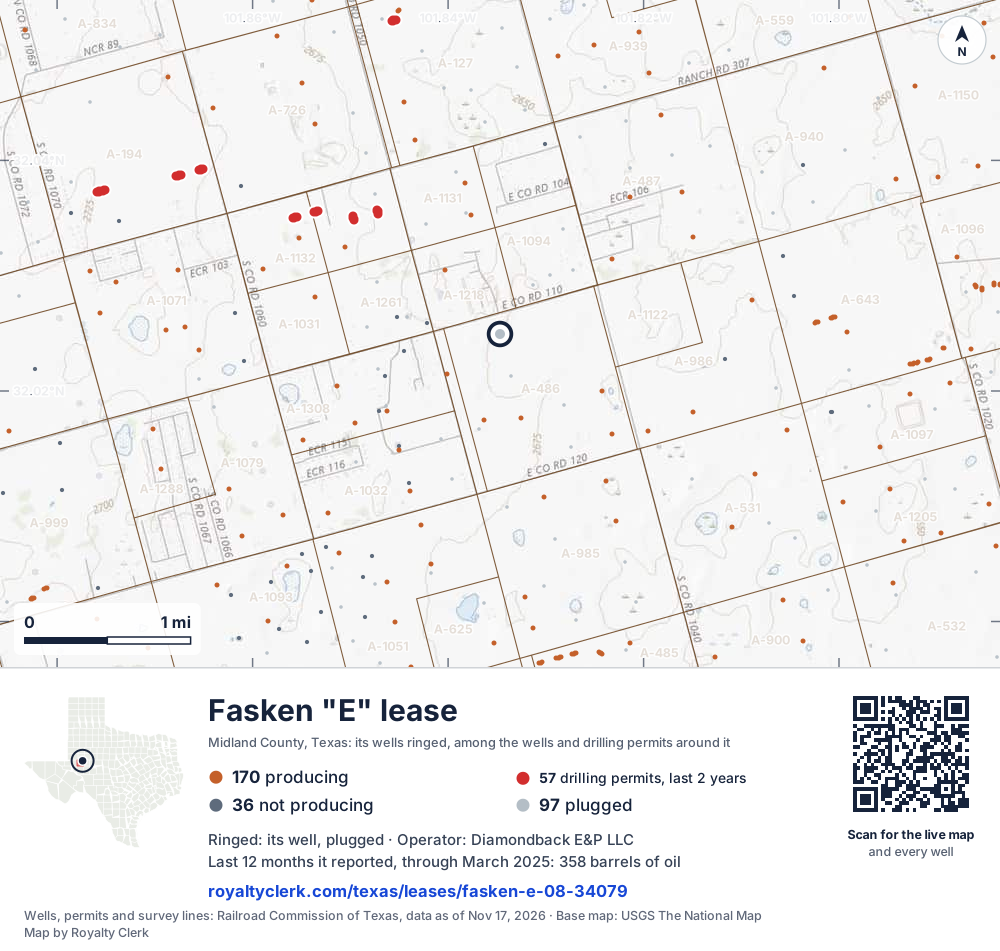
- This lease1Its well, ringed on the map: plugged
- Drilling locations57Permits issued in the last two years
- Producing wells170On a lease reporting production now
- Not producing38Shut in, inactive or no lease on record
- Plugged95The state's wellbore record says plugged
The ringed dot is this lease's well, where the Railroad Commission's map puts it. The other dots are wells and drilling permits of the last 24 months on the land around it; the counts are for everything in the picture, which is about 6 miles across. The thin brown lines are the original land surveys; where there is room, a survey carries its abstract number, the number deeds and division orders cite. Sources: Railroad Commission of Texas well layers, drilling permit files and survey lines, base map from USGS The National Map.
A one-page map of this lease to print, for a lawyer, a buyer or a probate file.
Use this map on your site
You may show this map on any site, unchanged. Keep the credit line and its link to Royalty Clerk under the map. The picture updates by itself as the state records new wells and permits.
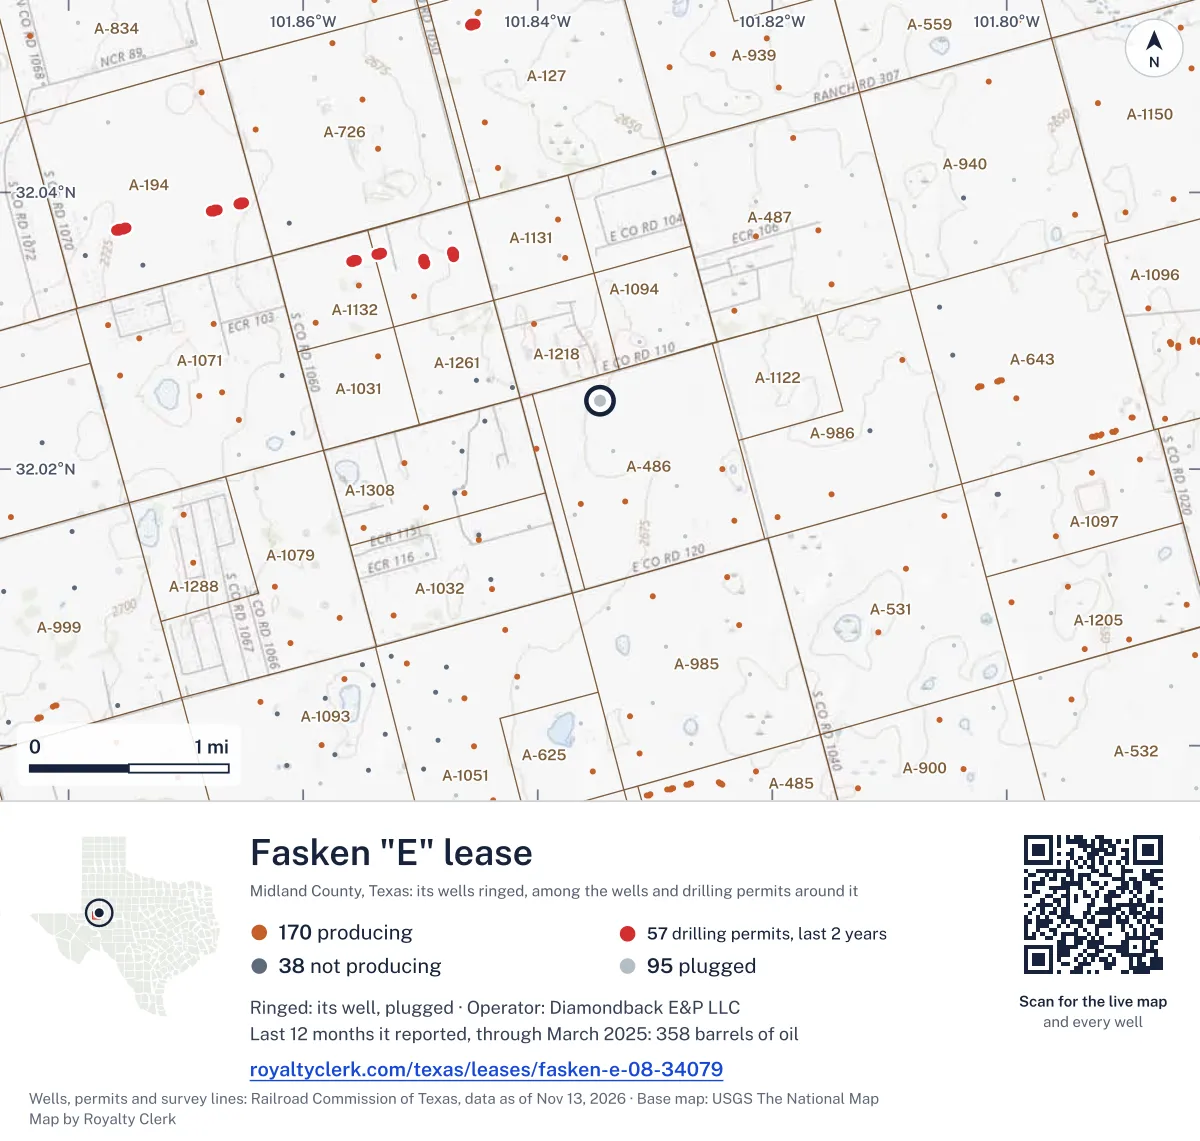
<a href="https://royaltyclerk.com/texas/leases/fasken-e-08-34079"><img src="https://royaltyclerk.com/maps/lease-wells/fasken-e-08-34079.svg" alt="Map of the Fasken "E" lease in Midland County, Texas: its well ringed, among 303 wells and 57 recent drilling locations in a picture about 6 miles across." width="1000" height="951" loading="lazy" style="max-width:100%;height:auto;border:0"></a>
<p style="margin:4px 0 0;font-size:14px">Map: <a href="https://royaltyclerk.com/texas/leases/fasken-e-08-34079">Wells on the Fasken "E" lease, Midland County, Texas</a> by Royalty Clerk, from Railroad Commission of Texas records</p>Other Fasken leases in Midland County
- Fasken 1G · 08-62812, oil leaseProducing304,706 bbllast 12 reported monthsRun by Ovintiv USA Inc.
- Fasken 1F · 08-62441, oil leaseProducing283,987 bbllast 12 reported monthsRun by Ovintiv USA Inc.
- Fasken 17G · 08-63188, oil leaseProducing242,440 bbllast 12 reported monthsRun by Ovintiv USA Inc.
- Fasken 17E · 08-63220, oil leaseProducing234,812 bbllast 12 reported monthsRun by Ovintiv USA Inc.
- Fasken 17X · 08-63237, oil leaseProducing206,964 bbllast 12 reported monthsRun by Ovintiv USA Inc.
- Fasken 17F · 08-63576, oil leaseProducing118,712 bbllast 12 reported monthsRun by Ovintiv USA Inc.
- Fasken 1X · 08-62837, oil leaseProducing30,083 bbllast 12 reported monthsRun by Ovintiv USA Inc.
- Fasken "B" · 08-40147, oil leaseProducing28,864 bbllast 12 reported monthsRun by Fasken Oil and Ranch, Ltd.
- Fasken "5" · 08-39142, oil leaseProducing13,673 bbllast 12 reported months
- Fasken "A" · 08-06560, oil leaseProducing8,207 bbllast 12 reported monthsRun by Extex Operating Company
- Fasken "56" · 08-37511, oil leaseProducing6,922 bbllast 12 reported months
- Fasken "F" · 08-34078, oil leaseProducing6,730 bbllast 12 reported months
Production by month
The 36 months up to its last report
- Oil (bars)
- Gas (line)
SourceTexas Railroad Commission Production Data Query, through Aug 2026.
Where the gas went
All of the gas went to a processing plant in the 7 months reported
SourceTexas Railroad Commission Production Data Query, through Aug 2026.
Who has run this lease
The operator changed once, most recently in Jan 2025
- Diamondback E&P LLC Jan 2025 to now
- Endeavor Energy Resources L.P. Jan 2020 to Dec 2024
SourceTexas Railroad Commission Production Data Query, through Aug 2026.
1 well on this lease
| API number | Well | Status | Completed |
|---|---|---|---|
| 42-329-32954 | Fasken "E" 1 | Plugged | Dec 1, 1993 |
The Railroad Commission's wellbore record marks this well plugged. A plugged well is closed for good.
SourceTexas Railroad Commission production records and full wellbore file.
Buyers and gatherers
| Company | Product | Role | Share% | From |
|---|---|---|---|---|
| Centurion Pipeline L.p. | Oil | Gathers | 100 | Sep 1, 2004 |
| Dcp Operating Company, LP | Casinghead gas | Buys | 100 | Apr 1, 2017 |
| Dcp Operating Company, LP | Casinghead gas | Gathers | 100 | Apr 1, 2017 |
SourceRailroad Commission Form P-4 file, Oct 24, 2026 (source).
80 acres on the newest permit
- Good to know
All listed wells are plugged
The RRC wellbore records mark all listed wells as plugged. These records do not show whether earlier royalties remain payable. Ask the payor about any unpaid months.
| API number | Well no. | Permit issued | Completed | Acreson the permit |
|---|---|---|---|---|
| 42-329-32954 | 1 | Nov 3, 1993 | Dec 1, 1993 | 80 |
What Diamondback Energy, Inc. told investors it received
| Quarter | Oil$ per bbl | Gas$ per mcf | Gas liquids$ per bbl | Filing |
|---|---|---|---|---|
| Q2 2026 | $96.82 | −$2.15 | $18.56 | SEC filing |
| Q1 2026 | $73.47 | $0.18 | $16.68 | SEC filing |
| Q4 2025 | $58.00 | $0.03 | $13.51 | SEC filing |
| Q3 2025 | $64.60 | $0.75 | $17.28 | SEC filing |
| Q2 2025 | $63.23 | $0.88 | $18.13 | SEC filing |
| Q1 2025 | $70.95 | $2.11 | $23.94 | SEC filing |
SourceDiamondback Energy, Inc. quarterly reports, SEC EDGAR, company-wide averages before hedging.
Estimate your royalty
36 months, newest first
| Month | Oil producedbbl | Oil soldbbl | Gas producedmcf | Gas soldmcf, codes 2+3 | Flaredmcf | WTI$/bbl | Henry Hub$/MMBtu |
|---|---|---|---|---|---|---|---|
| Mar 2025Diamondback E&P | 0 | 0 | 0 | 0 | 0 | $68.24 | $4.12 |
| Feb 2025Diamondback E&P | 0 | 0 | 0 | 0 | 0 | $71.53 | $4.19 |
| Jan 2025Diamondback E&P | 0 | 21 | 0 | 0 | 0 | $75.74 | $4.13 |
| Dec 2024Endeavor Energy | 0 | 0 | 0 | 0 | 0 | $70.12 | $3.01 |
| Nov 2024Endeavor Energy | 0 | 0 | 0 | 0 | 0 | $69.95 | $2.12 |
| Oct 2024Endeavor Energy | 20 | 9 | 0 | 0 | 0 | $71.99 | $2.20 |
| Sep 2024Endeavor Energy | 14 | 9 | 0 | 0 | 0 | $70.24 | $2.28 |
| Aug 2024Endeavor Energy | 22 | 33 | 0 | 0 | 0 | $76.68 | $1.99 |
| Jul 2024Endeavor Energy | 78 | 64 | 0 | 0 | 0 | $81.80 | $2.07 |
| Jun 2024Endeavor Energy | 7 | 21 | 0 | 0 | 0 | $79.77 | $2.54 |
| May 2024Endeavor Energy | 104 | 100 | 0 | 0 | 0 | $80.02 | $2.12 |
| Apr 2024Endeavor Energy | 113 | 138 | 0 | 0 | 0 | $85.35 | $1.60 |
| Mar 2024Endeavor Energy | 109 | 114 | 0 | 0 | 0 | $81.28 | $1.49 |
| Feb 2024Endeavor Energy | 119 | 107 | 0 | 0 | 0 | $77.25 | $1.72 |
| Jan 2024Endeavor Energy | 72 | 123 | 0 | 0 | 0 | $74.15 | $3.18 |
| Dec 2023Endeavor Energy | 149 | 96 | 0 | 0 | 0 | $71.90 | $2.52 |
| Nov 2023Endeavor Energy | 155 | 204 | 0 | 0 | 0 | $77.69 | $2.71 |
| Oct 2023Endeavor Energy | 149 | 168 | 0 | 0 | 0 | $85.64 | $2.98 |
| Sep 2023Endeavor Energy | 351 | 280 | 7 | 7 | 0 | $89.43 | $2.64 |
| Aug 2023Endeavor Energy | 125 | 110 | 57 | 57 | 0 | $81.39 | $2.58 |
| Jul 2023Endeavor Energy | 40 | 37 | 0 | 0 | 0 | $76.07 | $2.55 |
| Jun 2023Endeavor Energy | 42 | 53 | 0 | 0 | 0 | $70.25 | $2.18 |
| May 2023Endeavor Energy | 46 | 36 | 0 | 0 | 0 | $71.58 | $2.15 |
| Apr 2023Endeavor Energy | 14 | 14 | 0 | 0 | 0 | $79.45 | $2.16 |
| Mar 2023Endeavor Energy | 16 | 16 | 0 | 0 | 0 | $73.28 | $2.31 |
| Feb 2023Endeavor Energy | 26 | 28 | 0 | 0 | 0 | $76.83 | $2.38 |
| Jan 2023Endeavor Energy | 30 | 35 | 0 | 0 | 0 | $78.12 | $3.27 |
| Dec 2022Endeavor Energy | 52 | 61 | 0 | 0 | 0 | $76.44 | $5.53 |
| Nov 2022Endeavor Energy | 50 | 43 | 0 | 0 | 0 | $84.37 | $5.45 |
| Oct 2022Endeavor Energy | 103 | 102 | 0 | 0 | 0 | $87.55 | $5.66 |
| Sep 2022Endeavor Energy | 67 | 70 | 0 | 0 | 0 | $84.26 | $7.88 |
| Aug 2022Endeavor Energy | 96 | 101 | 5 | 5 | 0 | $93.67 | $8.81 |
| Jul 2022Endeavor Energy | 117 | 108 | 19 | 19 | 0 | $101.62 | $7.28 |
| Jun 2022Endeavor Energy | 31 | 21 | 7 | 7 | 0 | $114.84 | $7.70 |
| May 2022Endeavor Energy | 27 | 37 | 13 | 13 | 0 | $109.55 | $8.14 |
| Apr 2022Endeavor Energy | 27 | 17 | 19 | 19 | 0 | $101.78 | $6.60 |
SourceTexas Railroad Commission Production Data Query, through Aug 2026. Prices: EIA, through Oct 2026. Updated Oct 30, 2026.
How to check your stub against this lease Checks stopped on this lease? See the likely reasonsNearby
This lease belongs to
Diamondback E&P LLC in Midland County
- MCCLINTIC "9"
694 bbl
- TP LAND TRUST "K"
467 bbl
- PARKS "4"
582 bbl
- FIELDS "13"
8,950 mcf
- TXL "3"
374 bbl
- DICKENSON 19A
388 bbl
- HALE -N-
407 bbl
- O'BRIEN 44
388 bbl
- REBEL FEE
229 bbl
- MIDLAND FEE
698 mcf
Spraberry (Trend Area) field
- UNIVERSITY CONSOLIDATED XIII
360 bbl
- THREE SISTERS
362 bbl
- HOFFERKAMP
342 bbl
- BECKHAM
361 bbl
- WALSH 7
287 bbl
- HOELSCHER "16"
314 bbl
- COX -A-
343 bbl
- LONG 14
283 bbl
- WRIGHT
353 bbl
- NICHOLS
337 bbl
Leases within 10 km
- FASKEN, ANDREW UNIT 7
7,966 bbl · 0.4 km
- JONES, L. C.
0 bbl · 0.6 km
- FASKEN STATE
1,965 bbl · 0.6 km
- GERMANIA (GRAYBURG) UNIT
3,259 bbl · 0.7 km
- CONNIE
4,277 bbl · 0.8 km
- FASKEN "A"
8,207 bbl · 0.8 km
- JALAPENO 7
5,461 bbl · 0.8 km
- NEWSOM
0 bbl · 0.9 km
- FASKEN "F"
6,730 bbl · 1.1 km
- HALE, EVA "12"
2,690 bbl · 1.2 km
Drilling permits within 10 km
CAZA PATO 21910 C 25-36 #03H
new drill · horizontal · Bta Oil Producers, LLC · Martin County · 8.3 km
Permit 0919987 · Nov 12, 2026
CAZA PATO 21910 D 25-36 #04H
new drill · horizontal · Bta Oil Producers, LLC · Martin County · 8.3 km
Permit 0919988 · Nov 12, 2026
CAZA PATO 21910 A 25-36 #01H
new drill · horizontal · Bta Oil Producers, LLC · Martin County · 8.3 km
Permit 0919976 · Nov 12, 2026
CAZA PATO 21910 B 25-36 #02H
new drill · horizontal · Bta Oil Producers, LLC · Martin County · 8.3 km
Permit 0919986 · Nov 12, 2026
DEEBO #1H
new drill · horizontal · Black Swan Opco, LLC · Glasscock County · 9.7 km
Permit 0919157 · Nov 10, 2026