
Texas oil leaseRRC 08-40144Producing
Nichols
Ten wells on 1,288 acres in Glasscock County. The lease produced 2,953 barrels of oil in the last 12 months, through August 2026.
- Operator
- Apache Corporation
- County
- Glasscock
- On record since
- March 2010
- Newest report on file
- August 2026
- Unit on the newest permit
- 1,288 acres
Outline: the original land surveys this lease's wells sit in. The State publishes no lease outlines. RRC surveys, 2026-09-29.
The story, from 198 monthly reports
2010 to 2026: it sold the most in 2013
March 2010: the first month the lease sold oil on record, 22 barrels.
December 2010: Apache Corporation took over.
January 2013: three new wells were completed on the lease.
2013: the year the lease sold the most, $5.07 million of oil and gas at public prices.
August 2026 is the newest monthly production report on file.
SourceRailroad Commission production reports, March 2010 through August 2026. Not a forecast, not reserves.
198 months against 7 other recordsNew
Every month since March 2010, and what else happened that month
The lease is the line on top. Under it, on the same clock: the weather, the State, the price, the wells next door, who ran the lease, who bought from it and the rest of the field. Move across it.
Oil averaged $62.17 a barrel · Apache Corporation
- No public record explains this drop.
Move the pointer or drag across the chart. The numbered buttons jump to each drop.
Monthly oil sold from this lease since March 2010, with eight record tracks beneath it. Use the left and right arrow keys to move month by month.. 198 months from March 2010 to August 2026. The most in one month: 6,267 barrels, July 2012. The newest month: 124 barrels. Moments marked: 1, Jun 2010; 2, Oct 2012; 3, Nov 2012; 4, Jun 2014; 5, Jun 2023; 6, Feb 2024; 7, Oct 2024; 8, May 2025.
SourcesProduction, cut-offs, operators and buyers: Railroad Commission of Texas. Weather: NOAA. Prices: U.S. Energy Information Administration. Fracs: FracFocus. A record in the same month is not proof of a cause. Through August 2026.
Royalty Watch tells you the month a drop starts, with the records from that month.Watch this lease
195 months, one line eachNew
No silent months since March 2010
A gap is a month with no oil and no gas reported. Many leases end after 60 to 90 days without production unless the lease says otherwise.
runs of two or more months with nothing reported, since March 2010.
barrels of oil and 1,924 thousand cubic feet of gas on the newest report on file with oil or gas, for August 2026, the State's newest month.
of 195 months with oil or gas reported since March 2010.
barrels of oil a day on average from September 2025 through August 2026, counting a month with no report on file as zero.
A shut-in payment or work on the wells can keep a lease alive through a gap. Your own lease paper decides.
SourceRailroad Commission production reports, March 2010 through May 2026. The newest months, after May 2026, are left out of the count because reports arrive late.
Royalty Watch tells you when a silent month starts, and drafts the letter asking whether the lease is still in force.Watch this lease
17 years of state records, 2010 to 2026
Sold since March 2010
$18.2million
Sales at public prices before tax and deductions. Multiply by your decimal interest to estimate your share.
- Oil sold
- 188,615barrels
- Gas sold
- 826,326thousand cubic feet
- Best year
- 2013$5.07 million sold
| Year | Oil, dollars | Gas, dollars | Total |
|---|---|---|---|
| 2010 | $315,000 | $54,200 | $369,000 |
| 2011 | $387,000 | $39,500 | $426,000 |
| 2012 | $4.06 million | $159,000 | $4.22 million |
| 2013 | $4.47 million | $602,000 | $5.07 million, sold the most |
| 2014 | $2.36 million | $605,000 | $2.96 million |
| 2015 | $659,000 | $264,000 | $923,000 |
| 2016 | $423,000 | $175,000 | $599,000 |
| 2017 | $386,000 | $151,000 | $536,000 |
| 2018 | $416,000 | $165,000 | $581,000 |
| 2019 | $288,000 | $63,000 | $351,000 |
| 2020 | $168,000 | $56,500 | $224,000 |
| 2021 | $275,000 | $104,000 | $379,000 |
| 2022 | $331,000 | $130,000 | $460,000 |
| 2023 | $292,000 | $55,800 | $348,000 |
| 2024 | $209,000 | $46,000 | $255,000 |
| 2025 | $264,000 | $68,500 | $332,000 |
| 2026, 2026 so far | $149,000 | $40,000 | $189,000 |
Did a relative own a share of this lease?
SourcesRailroad Commission Production Data Query, every monthly report since March 2010. EIA monthly WTI and Henry Hub prices. 2026 is part of a year, drawn lighter. Not a forecast, not reserves.
Who has run this lease
The operator changed once, most recently in December 2010
The company named on each monthly report to the State. The operator is not always the company that pays.
- Apache CorporationDecember 2010 to now
- Operator number 526155March 2010 to November 2010
SourcesRailroad Commission production reports, the operator on each month’s report, March 2010 through August 2026.
The newest well, seen from the side
No well on the way. Well 2213 was completed in August 2014.
- Permit filedNot on file
- Drilling startedNot on file
- FrackedNot on file
- Completion filedAugust 13, 2014
- First production on the leaseNot on file
- First checkNot on file
SourcesRailroad Commission drilling permits and well records, and the FracFocus registry. Lease record built November 17, 2026.
Royalty Watch follows new well permits and completions on this lease.Watch this lease
About 7 miles across
Wells on this lease and around it
For a lawyer, a buyer or a probate file. Wells and permits within about 2 miles. Railroad Commission of Texas, FracFocus and USGS imagery.
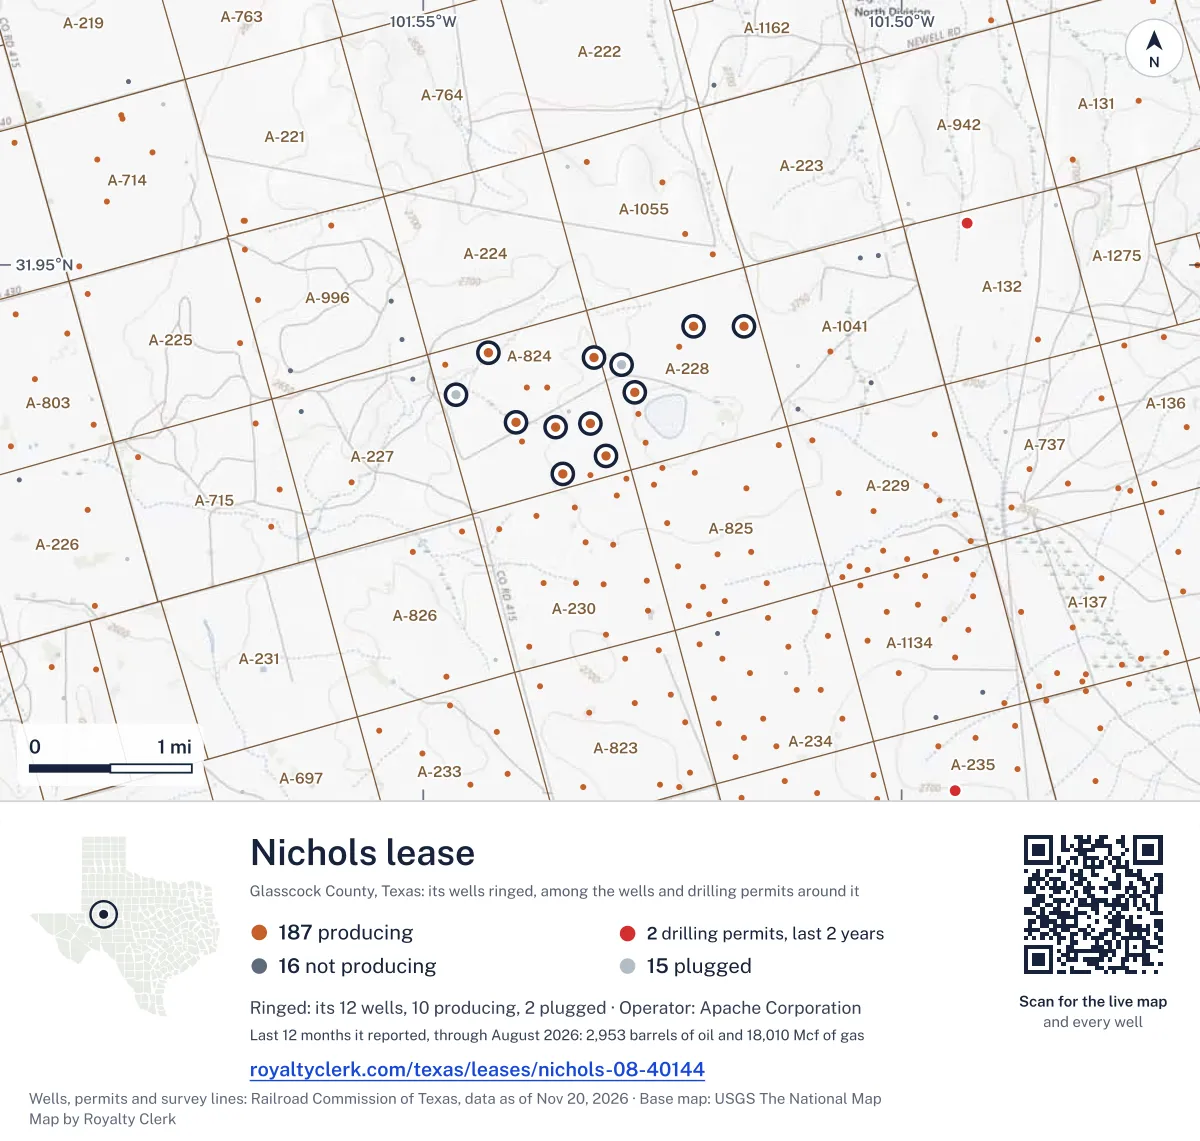
From the State's well records
Twelve wells on this lease, two plugged
| Well | API number | Completed | Depthfeet | Today |
|---|---|---|---|---|
| 2301 | 42-173-33607 | March 2010 | 10,456 | Plugged |
| 2202 | 42-173-34251 | November 2011 | 10,758 | Shut in |
| 2203 | 42-173-34476 | January 2012 | 10,780 | Active |
| 2204 | 42-173-34608 | March 2012 | 10,698 | Active |
| 2208 | 42-173-35304 | January 2013 | 10,735 | Active |
| 2207 | 42-173-35303 | January 2013 | 10,765 | Active |
| 2209 | 42-173-35369 | January 2013 | 10,675 | Active |
| 2210 | 42-173-35510 | April 2013 | 10,780 | Plugged |
| 2307 | 42-173-36242 | March 2014 | 10,715 | Active |
| 2309 | 42-173-36454 | May 2014 | 10,670 | Active |
| 2308 | 42-173-36364 | June 2014 | 10,725 | Active |
| 2213 | 42-173-36471 | August 2014 | 10,743 | Active |
SourceRailroad Commission wellbore and completion records.
What the drilling permits say
1,288acres on the newest permit
- 644 acres, on the 2011 permits
- 1,288 acres, on the 2012 to 2014 permits
The acres changed between permits. 644 acres, on the 2011 permits; 1,288 acres, on the 2012 to 2014 permits. When a unit grows, every owner’s decimal is figured again.
Oil, August 2026, dollars per barrel New
Four prices for the same oil
What the market paid, what the operator told its investors, what it told the tax office for this lease, and the one only you hold.
The State approved a lower tax for this lease
- Kind
- Low Producing Leases
- Wells
- The whole lease
- Runs
- February 2016 to no end date on file
- Rate
- Not given in the file
Look at the tax line on your statement for this lease. The record says which rate applies.
Estimate your royalty
Type the decimal from your division order
The starting decimal is an example. Nothing you type here leaves this page.
$97a month
At these prices the whole lease’s reported sales were about $298,000 over 12 reported months. Your estimated share is $1,170 before taxes and deductions.
Monthly owner volumes and values
| Month | Oil (bbl) | Oil value | Gas (mcf) | Gas value | Total |
|---|---|---|---|---|---|
| August 2026 | 0.4844 | $40.64 | 7.5156 | $20.89 | $61.53 |
| July 2026 | 0.9648 | $77.63 | 8.2266 | $23.77 | $101.41 |
| June 2026 | 0.8711 | $73.88 | 8 | $25.20 | $99.08 |
| May 2026 | 1.0313 | $105.32 | 4.3164 | $12.69 | $118.01 |
| April 2026 | 0.8594 | $86.21 | 2.5 | $6.93 | $93.14 |
| March 2026 | 0.8789 | $80.31 | 2.4414 | $7.42 | $87.74 |
| February 2026 | 1.0352 | $66.78 | 2.293 | $8.30 | $75.08 |
| January 2026 | 0.8828 | $53.00 | 6.5977 | $50.93 | $103.94 |
| December 2025 | 1.375 | $79.71 | 6.1641 | $26.26 | $105.97 |
| November 2025 | 1.5781 | $94.78 | 5.2383 | $19.85 | $114.64 |
| October 2025 | 1.0664 | $64.93 | 7.0586 | $22.52 | $87.45 |
| September 2025 | 1.4805 | $94.69 | 7.668 | $22.77 | $117.46 |
SourcesMarket: U.S. Energy Information Administration (WTI Cushing for oil; Henry Hub for gas, taken per thousand cubic feet). Investors: APA Corporation, Form 10-Q, Q3 2026, company-wide. Tax office and tax approval: Texas Comptroller. The third price shows once the Comptroller's records for this lease have arrived. As of October 1, 2026.
Watch Plus sets these prices beside the price on each of your statements, every month.See Watch Plus
Who takes the oil and gasNew
No buyer shares an owner with the operator
The State lists who gathers and who buys from each lease. Company filings list who owns whom. Here they are on one drawing.
No shared owner, officer or address on record between the oil buyers and the operator.
Also on the P-4: ENERGY TRANS CRUDE MARKETING LLC gathers 25% and ENERGY TRANSFER MARKETING & TERM gathers 25%.
No shared owner, officer or address on record between the gas buyers and the operator.
Also on the P-4: DCP OPERATING COMPANY, LP buys 50%.
Earlier buyers and gatherers, back to 1993
| Company | Product | Role | From | Until |
|---|---|---|---|---|
| SUNOCO PTNRS. MKTG.&TERMINALS LP | Oil | Gathers | Jul 2021 | Dec 2022 |
| SUNOCO PIPELINE L.P. | Oil | Gathers | Mar 2012 | Jul 2021 |
Who buys my oilOil price check
SourcesBuyers and gatherers: Railroad Commission Form P-4 records, as of October 24, 2026. Ownership: U.S. Securities and Exchange Commission filings.
Royalty Watch tells you the day the buyer of your oil or gas changes.Watch this lease
Seen from space, 2025New
No satellite heat at this pad in 2025
Weather satellites pass over Texas every night and record heat on the ground. Drag the photo from day to night. Beside it, each night of 2025 next to what the operator reported burning.
A lit dot is a night a satellite recorded heat within 500 m of a well on this lease. The red bar is gas reported vented or flared that month.
nights with heat recorded at this pad, 2025.
months in which flaring was reported, 74 thousand cubic feet in all.
months with heat seen and no flaring reported.
Where the gas went in 2025, as the operator reported it
SourcesHeat: NOAA-20, NOAA-21 and Suomi NPP (to November 2, 2026) VIIRS active fire product, night readings (NOAA open data); the readings at this pad from NOAA-20, NOAA-21 and Suomi NPP, through November 16, 2026. Reported flaring and gas use: Railroad Commission production reports. Cloud hides heat, so the count of nights is a floor. The satellite records heat. It does not say what burned.
Watch Plus checks whether you were paid on gas in the months heat was seen.See Watch Plus
Where the gas went, month by month
97% of the gas went to a processing plant in the last 12 months
Where gas goes decides how it is paid: processed gas can carry plant products and processing fees, gas sold straight to a pipeline usually does not.
- Processing plant (3)97% · 17,413 mcf
- Lease fuel (1)3.1% · 552 mcf
- Flared (4)0.2% · 45 mcf
0.2% of the gas was flared in the last 12 months. 3 months above 3%, the most 5.2% in May 2025.
SourcesRailroad Commission production reports, gas disposition by code, September 2023 to August 2026.
The county appraisal roll
Roll not on file
County mineral roll
Roll not on file
Glasscock Appraisal District’s mineral roll has not been read here yet.
Royalty Clerk has mineral rolls for 158 Texas counties.
Source County appraisal district mineral rolls.
From the state record
What owners ask about Nichols
- 01When is the check for August 2026 due?
- Aug 31sale month endsOct 30oil dueNov 29gas due
- August 2026 is the newest month the state has posted for this lease. Texas law gives the payor until 60 days after the end of the sale month for oil and 90 for gas: the oil by Oct 30, 2026 and the gas by Nov 29, 2026, unless the lease sets another time.
- Source: Railroad Commission production reports; Texas Natural Resources Code §91.402.
- See your next three checks
- 02Which Texas production tax rate applies?
- Gas7.50%Oil4.60%
- The Texas Comptroller lists low producing leases for this lease, from Feb 1, 2016. Its file does not give the rate, so we compare your stub with the full 4.6%. That is for August 2026.
- Source: Texas Comptroller, approved severance tax exemptions.
- Check the tax on your stub
- 03Who buys the oil and gas?
- OILPlains Marketing, L.p.50%GASApache Corporation50%
- Oil: Plains Marketing, L.p., Energy Trans Crude Marketing LLC and Energy Transfer Marketing & Term gather it. Gas from oil wells: Apache Corporation buys and gathers it; Dcp Operating Company, LP buys it. The buyer's price is what a royalty check is figured on.
- Source: Railroad Commission Form P-4, gatherers and purchasers.
- See every buyer and past buyers
- 04How many 1099s should an owner expect for 2025?
- 1January to December 2025: one operator of record in all 12 months
- One company, Apache Corporation, filed this lease's reports behind every 2025 check, so most owners get one form. The operator is not always the company that pays, so go by the name on the stubs.
- Source: Railroad Commission production reports, operator of record by month.
- Check your 1099 against it
Every monthly report the State holds
198 months, newest first
| Month | Oil soldbarrels | Gas soldthousand cubic feet | Flared or ventedthousand cubic feet | Sold forat public prices | Operator |
|---|---|---|---|---|---|
| AugustAug 2026 | 124 | 1,924 | 0 | $15,800 | Apache Corporation |
| JulyJul 2026 | 247 | 2,106 | 0 | $26,000 | Apache Corporation |
| JuneJun 2026 | 223 | 2,048 | 1 | $25,400 | Apache Corporation |
| MayMay 2026 | 264 | 1,105 | 0 | $30,200 | Apache Corporation |
| AprilApr 2026 | 220 | 640 | 25 · 3.91% | $23,800 | Apache Corporation |
| MarchMar 2026 | 225 | 625 | 1 | $22,500 | Apache Corporation |
| FebruaryFeb 2026 | 265 | 587 | 0 | $19,200 | Apache Corporation |
| JanuaryJan 2026 | 226 | 1,689 | 0 | $26,600 | Apache Corporation |
| DecemberDec 2025 | 352 | 1,578 | 0 | $27,100 | Apache Corporation |
| NovemberNov 2025 | 404 | 1,341 | 5 | $29,300 | Apache Corporation |
| OctoberOct 2025 | 273 | 1,807 | 13 | $22,400 | Apache Corporation |
| SeptemberSep 2025 | 379 | 1,963 | 0 | $30,100 | Apache Corporation |
| AugustAug 2025 | 320 | 2,872 | 0 | $29,100 | Apache Corporation |
| JulyJul 2025 | 324 | 1,547 | 0 | $27,100 | Apache Corporation |
| JuneJun 2025 | 396 | 1,163 | 0 | $30,500 | Apache Corporation |
| MayMay 2025 | 172 | 855 | 47 · 5.50% | $13,400 | Apache Corporation |
| AprilApr 2025 | 500 | 1,494 | 9 | $36,900 | Apache Corporation |
| MarchMar 2025 | 353 | 1,617 | 0 | $30,800 | Apache Corporation |
SourcesTexas Railroad Commission Production Data Query, through August 2026. Prices: EIA.
Likely owed Jan 2025
A whole month was never paid
The state shows 28,175 bbl of oil sold from this lease in January 2025, so your share is 27.51 bbl. No statement covers January 2025. That is the month the operator changed from Endeavor Energy Resources to Diamondback.
Ask Diamondback owner relations: is January 2025 being held in suspense after the change of operator?
$2,277oil + gas
A sample finding, from our example check. The full example found $3,328 likely owed.
Around this lease
Nearby
Apache Corporation in Glasscock County
- Duff 73,823 bbl last 12 months
- Burns 273,015 bbl last 12 months
- E.d. Books 132,506 bbl last 12 months
- Phillips, H.3,854 bbl last 12 months
- His Blessing 351,883 bbl last 12 months
- Walker Farms 142,451 bbl last 12 months
- Dolphin 122,588 bbl last 12 months
- Huitt 253,227 bbl last 12 months
- Foxtrot 31895 bbl last 12 months
- Nichols3,103 bbl last 12 months
Spraberry (Trend Area) field
- University Lands 8-13,302 bbl last 12 months
- His Blessing 351,883 bbl last 12 months
- Strain "20"3,006 bbl last 12 months
- Big Max 25 Ne3,371 bbl last 12 months
- Millie C2,944 bbl last 12 months
- Bluegill 422,561 bbl last 12 months
- Brazos SN 17-8 031,037 bbl last 12 months
- Newland-Ballard "16"3,560 bbl last 12 months
- Bailey3,582 bbl last 12 months
- Snider 132,697 bbl last 12 months
Leases within 10 km
- Nichols3,103 bbl last 12 months · 0.2 km
- Nichols1,562 bbl last 12 months · 0.8 km
- Copeland 276,436 bbl last 12 months · 0.9 km
- Anderson 26930 bbl last 12 months · 1 km
- Anderson 261,356 bbl last 12 months · 1.1 km
- Copeland 274,330 bbl last 12 months · 1.1 km
- Poseidon 21no production in the last 12 months · 1.7 km
- Doralee508 bbl last 12 months · 1.8 km
- Doralee518 bbl last 12 months · 1.8 km
- CH Ranch1,329 bbl last 12 months · 1.9 km
Drilling permits within 10 km
- MCDOWELL, L.S. 'B' #7new drill · R H Well Service, Inc. · Oct 6, 2026 · 9.9 km
- BANDON B #212Hnew drill · horizontal · Civitas Permian Operating, LLC · Jun 22, 2026 · 7.1 km
- PACIFIC B #312Hnew drill · horizontal · Civitas Permian Operating, LLC · Jun 22, 2026 · 6.5 km
- BANDON A #311Hnew drill · horizontal · Civitas Permian Operating, LLC · Jun 22, 2026 · 7.1 km
- PACIFIC A #311Hnew drill · horizontal · Civitas Permian Operating, LLC · Jun 22, 2026 · 6.5 km
Same name in district 08
- Nichols3,103 bbl last 12 months
- Nichols2,385 bbl last 12 months
- Nichols2,269 bbl last 12 months
- Nichols1,562 bbl last 12 months
- Nichols337 bbl last 12 months
- Nichols144 bbl last 12 months
- Nichols2,366 bbl last 12 months
- Nichols84 bbl last 12 months
- Nicholsno production in the last 12 months
- Nicholsno production in the last 12 months
- Nicholsno production in the last 12 months
Where it sits
This county
Where this page comes from
- Railroad Commission of Texas production, Form P-4, permits, wells
- Texas Comptroller tax approvals, lease values
- U.S. Energy Information Administration prices
- SEC EDGAR company filings
- FracFocus frac dates
- NOAA storms and cold
- NOAA-20, NOAA-21 and Suomi NPP (to November 2, 2026) VIIRS active fire product, night readings (NOAA open data) night heat
- U.S. Geological Survey photos