
Texas oil lease
StoppedRYAN 6
Ryan 6 is an oil lease in Howard County, Texas, in the Spraberry (Trend Area) field. It stopped producing after January 2025: nothing has been reported for 1 year 7 months since. Gas was last produced in January 2025, but the last sale reported was February 2023. Ovintiv USA Inc was its last operator.
This lease has stopped
Gas was last produced in Jan 2025, but the last sale reported was Feb 2023.
- Last operator
- Ovintiv USA Inc.
- County
- Howard County
- RRC lease
- 08-43384
37 royalty accounts on the county roll
Is your family on this lease?
Where it sits
This county
- Silent for
- 1 year 7 months
- First report
- Jun 2012
Ryan 6, 2012–2026
Its whole life in the Railroad Commission’s monthly reports, which start in January 1993; it first reported in June 2012. Gas was last produced in Jan 2025, but the last sale reported was Feb 2023. Royalty owners and their heirs can still be on the county roll after the checks stop.
- First reportJun 2012
- Best year2013$697,000 sold
- Last operatorOvintiv USA Inc.from Feb 2020
- Last sale reportedFeb 2023
- Last gas producedJan 2025
- Silent for1 year 7 monthsthrough Aug 2026
- Oil sold since June 2012
- 26,936barrels
- Gas sold since June 2012
- 116,503thousand cubic feet (mcf)
- Sold for, in all
- $2.4 millionat each month's public prices, 100% of the lease
- Still on the county roll
- 37royalty accounts, tax year 2026
Source: Texas Railroad Commission production reports since January 1993 (oil and gas sold); EIA prices, through August 2026.
Every year as a table
| Year | Months | Oil sold, bbl | Gas sold, mcf | Sold for |
|---|---|---|---|---|
| 2026 * | 8 | 0 | 0 | $0 |
| 2025 | 12 | 0 | 0 | $0 |
| 2024 | 12 | 0 | 0 | $0 |
| 2023 | 12 | 179 | 197 | $14,624 |
| 2022 | 12 | 974 | 3,914 | $119,573 |
| 2021 | 12 | 1,478 | 7,169 | $128,144 |
| 2020 | 12 | 1,512 | 8,516 | $77,995 |
| 2019 | 12 | 2,113 | 8,261 | $141,565 |
| 2018 | 12 | 1,062 | 4,557 | $82,655 |
| 2017 | 12 | 2,223 | 8,815 | $139,081 |
| 2016 | 12 | 1,894 | 9,464 | $108,938 |
| 2015 | 12 | 1,241 | 7,963 | $80,765 |
| 2014 | 12 | 1,803 | 9,413 | $210,027 |
| 2013 | 12 | 6,329 | 20,993 | $697,861 |
| 2012 | 7 | 6,128 | 27,241 | $638,608 |
* Part of the year: the records run through August 2026.
For families and heirs
What an heir can do next
Search the family name
The county roll still lists 37 royalty accounts under this lease. Type the name from an old check stub, a deed or the will.
Search a nameSee why the checks stopped
Checks stop when a lease stops, when the operator changes, or when an account goes into suspense. See which one the state's records point to.
Check this leaseValue an inherited share
A relative owned a share? See what it earned after they died, month by month, from the state's records.
Start with the estateHear if it starts again
Stopped leases are sometimes reworked or taken over by a new operator. Get an email when this one reports again.
Email me if it restarts
Did a relative own a share of this lease?
Pick the year they passed and see what the lease has sold since.
Wells on this lease and around it
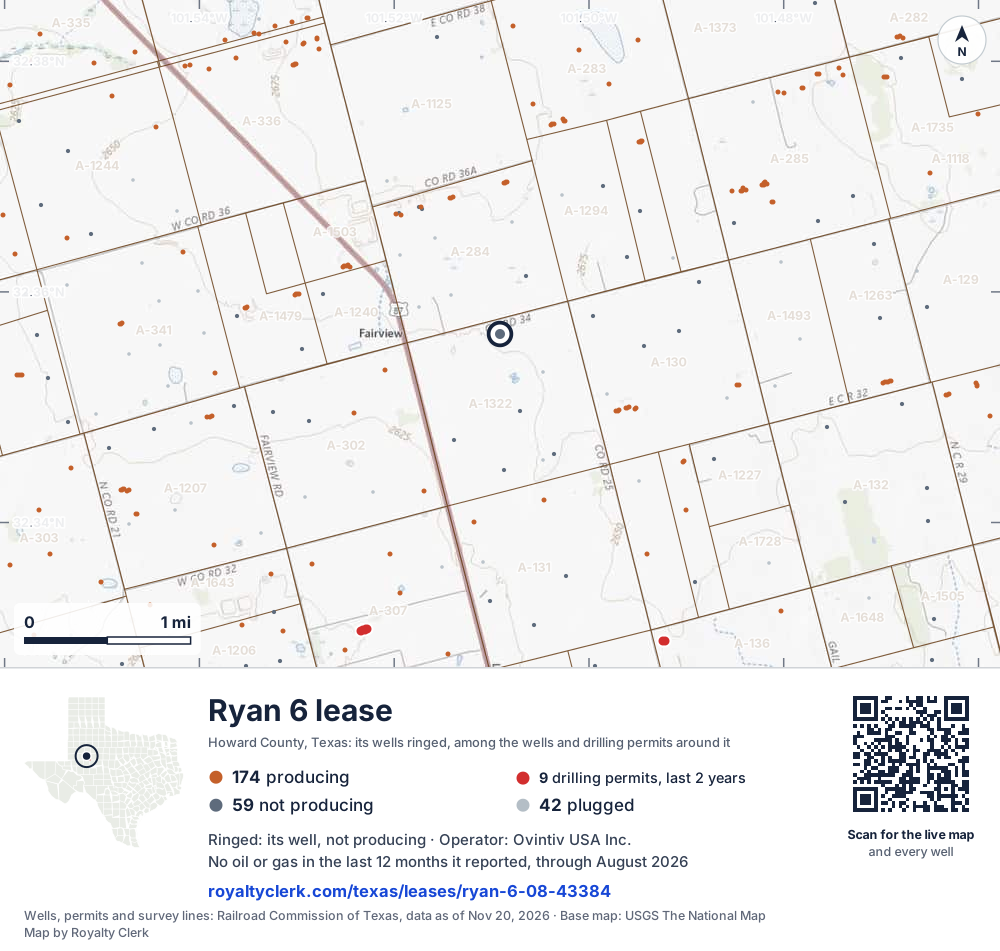
- This lease1Its well, ringed on the map: not producing
- Drilling locations9Permits issued in the last two years
- Producing wells174On a lease reporting production now
- Not producing59Shut in, inactive or no lease on record
- Plugged42The state's wellbore record says plugged
The ringed dot is this lease's well, where the Railroad Commission's map puts it. The other dots are wells and drilling permits of the last 24 months on the land around it; the counts are for everything in the picture, which is about 6 miles across. The thin brown lines are the original land surveys; where there is room, a survey carries its abstract number, the number deeds and division orders cite. Sources: Railroad Commission of Texas well layers, drilling permit files and survey lines, base map from USGS The National Map.
A one-page map of this lease to print, for a lawyer, a buyer or a probate file.
Use this map on your site
You may show this map on any site, unchanged. Keep the credit line and its link to Royalty Clerk under the map. The picture updates by itself as the state records new wells and permits.
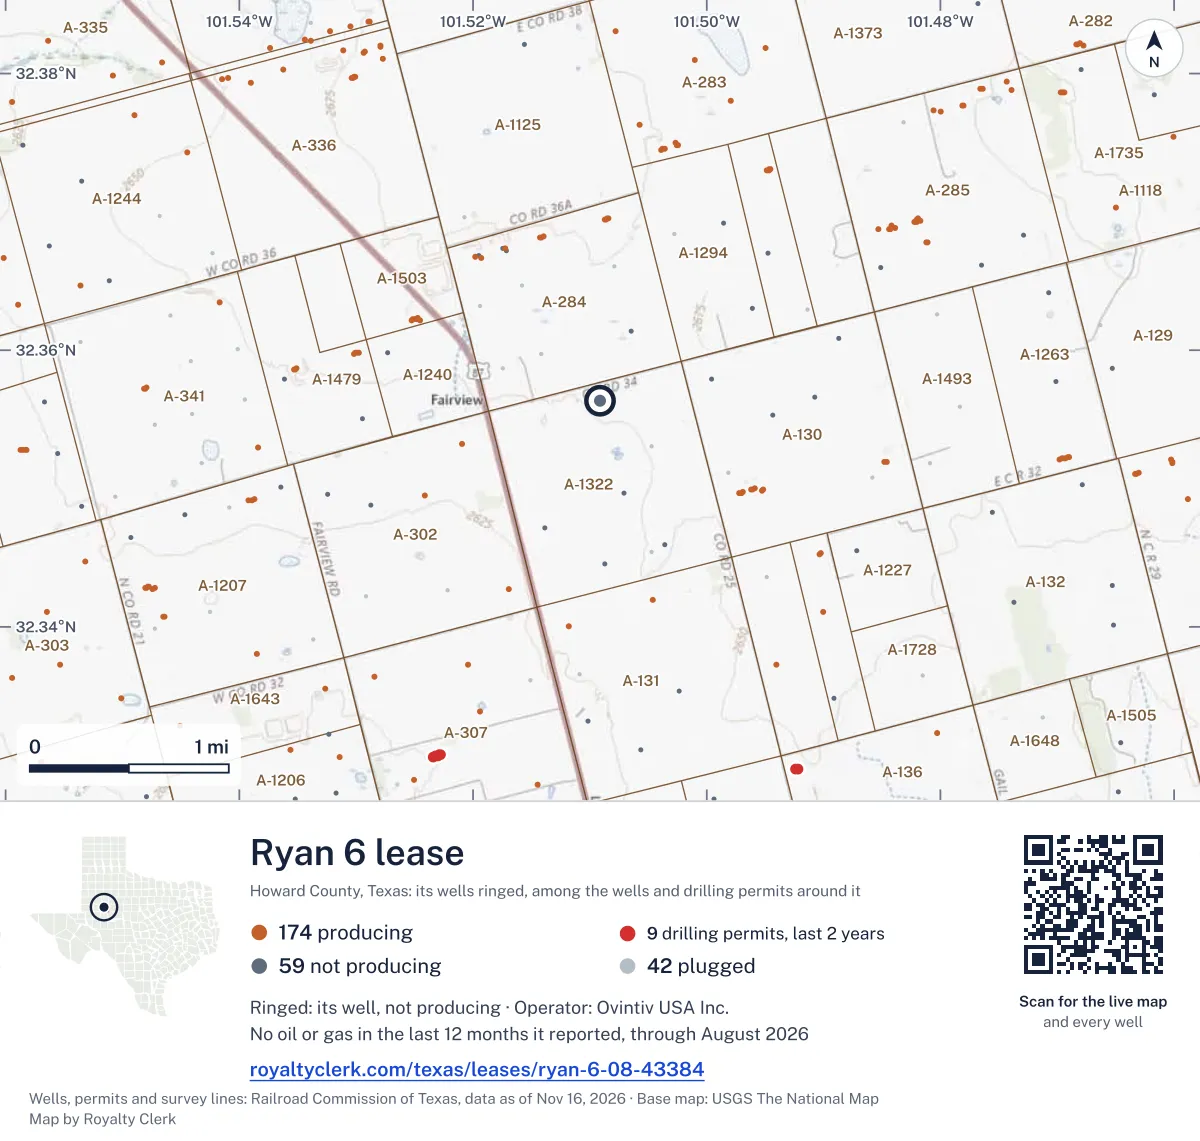
<a href="https://royaltyclerk.com/texas/leases/ryan-6-08-43384"><img src="https://royaltyclerk.com/maps/lease-wells/ryan-6-08-43384.svg" alt="Map of the Ryan 6 lease in Howard County, Texas: its well ringed, among 275 wells and 9 recent drilling locations in a picture about 6 miles across." width="1000" height="951" loading="lazy" style="max-width:100%;height:auto;border:0"></a>
<p style="margin:4px 0 0;font-size:14px">Map: <a href="https://royaltyclerk.com/texas/leases/ryan-6-08-43384">Wells on the Ryan 6 lease, Howard County, Texas</a> by Royalty Clerk, from Railroad Commission of Texas records</p>
Other Ryan leases in Howard County
- Ryan D · 08-51397, oil leaseProducing22,472 bbllast 12 reported monthsRun by Hibernia Resources IV, LLC
- Ryan B · 08-50965, oil leaseProducing14,656 bbllast 12 reported monthsRun by Hibernia Resources IV, LLC
- Ryan C · 08-50987, oil leaseProducing15,366 bbllast 12 reported monthsRun by Hibernia Resources IV, LLC
- Ryan A · 08-50599, oil leaseProducing13,497 bbllast 12 reported monthsRun by Hibernia Resources IV, LLC
Production by month
The 36 months up to its last report
- Oil (bars)
- Gas (line)
SourceTexas Railroad Commission Production Data Query, through Aug 2026.
Where the gas went
All of the gas went to lease fuel in the only month reported
SourceTexas Railroad Commission Production Data Query, through Aug 2026.
Who has run this lease
The operator changed once, most recently in Feb 2020
- Ovintiv USA Inc. Feb 2020 to now
- Encana Oil & Gas(usa) Inc. Jan 2020 to Jan 2020
SourceTexas Railroad Commission Production Data Query, through Aug 2026.
1 well on this lease
| API number | Well | Status | Completed |
|---|---|---|---|
| 42-227-36894 | Ryan 6 1 | Shut in | Jul 5, 2012 |
SourceTexas Railroad Commission production records and full wellbore file.
Buyers and gatherers
| Company | Product | Role | Share% | From | Until |
|---|---|---|---|---|---|
| Bml, Inc. B | Oil | Gathers | 100 | Mar 1, 2023 | – |
| Enterprise Products Operating LLC | Casinghead gas | Buys | 100 | May 1, 2022 | – |
| Enterprise Products Operating LLC | Casinghead gas | Gathers | 100 | May 1, 2022 | – |
| Ngl Crude Logistics, LLC | Oil | Gathers | 100 | Sep 1, 2014 | Mar 1, 2023 |
| Navitas Mdstr Midland Basin, LLC | Casinghead gas | Gathers | 100 | Jun 1, 2017 | May 1, 2022 |
| Navitas Mdstr Midland Basin, LLC | Casinghead gas | Buys | 100 | Jun 1, 2017 | May 1, 2022 |
SourceRailroad Commission Form P-4 file, Oct 24, 2026 (source).
What Ovintiv Inc. told investors it received
| Quarter | Oil$ per bbl | Gas$ per mcf | Gas liquids$ per bbl | Filing |
|---|---|---|---|---|
| Q3 2026 | $86.53 | $2.45 | $20.26 | SEC filing |
| Q2 2026 | $100.69 | $1.71 | $92.75 | SEC filing |
| Q1 2026 | $72.62 | $3.14 | $18.12 | SEC filing |
| Q4 2025 | $59.55 | $2.65 | $32.76 | SEC filing |
| Q3 2025 | $66.22 | $1.79 | $16.91 | SEC filing |
| Q2 2025 | $64.50 | $2.24 | $60.79 | SEC filing |
SourceOvintiv Inc. quarterly reports, SEC EDGAR, company-wide averages before hedging.
On the Howard County roll
Howard County Appraisal District
2026 roll- Owners
- 40
- Accounts
- 40
- Appraised in all
- $16,850
Each square is one account
- Royalty37
- Overriding royalty2
- Working interest1
SourceHoward County Appraisal District, 2026 mineral roll (source), read Sep 29, 2026. Accounts matched to this lease by RRC number or lease name; no owner is named.
Estimate your royalty
36 months, newest first
| Month | Gas producedmcf | Gas soldmcf, codes 2+3 | Flaredmcf | WTI$/bbl | Henry Hub$/MMBtu |
|---|---|---|---|---|---|
| Aug 2026Ovintiv USA | 0 | 0 | 0 | $83.90 | $2.78 |
| Jul 2026Ovintiv USA | 0 | 0 | 0 | $80.46 | $2.89 |
| Jun 2026Ovintiv USA | 0 | 0 | 0 | $84.81 | $3.15 |
| May 2026Ovintiv USA | 0 | 0 | 0 | $102.13 | $2.94 |
| Apr 2026Ovintiv USA | 0 | 0 | 0 | $100.32 | $2.77 |
| Mar 2026Ovintiv USA | 0 | 0 | 0 | $91.38 | $3.04 |
| Feb 2026Ovintiv USA | 0 | 0 | 0 | $64.51 | $3.62 |
| Jan 2026Ovintiv USA | 0 | 0 | 0 | $60.04 | $7.72 |
| Dec 2025Ovintiv USA | 0 | 0 | 0 | $57.97 | $4.26 |
| Nov 2025Ovintiv USA | 0 | 0 | 0 | $60.06 | $3.79 |
| Oct 2025Ovintiv USA | 0 | 0 | 0 | $60.89 | $3.19 |
| Sep 2025Ovintiv USA | 0 | 0 | 0 | $63.96 | $2.97 |
| Aug 2025Ovintiv USA | 0 | 0 | 0 | $64.86 | $2.91 |
| Jul 2025Ovintiv USA | 0 | 0 | 0 | $68.39 | $3.20 |
| Jun 2025Ovintiv USA | 0 | 0 | 0 | $68.17 | $3.02 |
| May 2025Ovintiv USA | 0 | 0 | 0 | $62.17 | $3.12 |
| Apr 2025Ovintiv USA | 0 | 0 | 0 | $63.54 | $3.42 |
| Mar 2025Ovintiv USA | 0 | 0 | 0 | $68.24 | $4.12 |
| Feb 2025Ovintiv USA | 0 | 0 | 0 | $71.53 | $4.19 |
| Jan 2025Ovintiv USA | 20 | 0 | 0 | $75.74 | $4.13 |
| Dec 2024Ovintiv USA | 0 | 0 | 0 | $70.12 | $3.01 |
| Nov 2024Ovintiv USA | 0 | 0 | 0 | $69.95 | $2.12 |
| Oct 2024Ovintiv USA | 0 | 0 | 0 | $71.99 | $2.20 |
| Sep 2024Ovintiv USA | 0 | 0 | 0 | $70.24 | $2.28 |
| Aug 2024Ovintiv USA | 0 | 0 | 0 | $76.68 | $1.99 |
| Jul 2024Ovintiv USA | 0 | 0 | 0 | $81.80 | $2.07 |
| Jun 2024Ovintiv USA | 0 | 0 | 0 | $79.77 | $2.54 |
| May 2024Ovintiv USA | 0 | 0 | 0 | $80.02 | $2.12 |
| Apr 2024Ovintiv USA | 0 | 0 | 0 | $85.35 | $1.60 |
| Mar 2024Ovintiv USA | 0 | 0 | 0 | $81.28 | $1.49 |
| Feb 2024Ovintiv USA | 0 | 0 | 0 | $77.25 | $1.72 |
| Jan 2024Ovintiv USA | 0 | 0 | 0 | $74.15 | $3.18 |
| Dec 2023Ovintiv USA | 0 | 0 | 0 | $71.90 | $2.52 |
| Nov 2023Ovintiv USA | 0 | 0 | 0 | $77.69 | $2.71 |
| Oct 2023Ovintiv USA | 0 | 0 | 0 | $85.64 | $2.98 |
| Sep 2023Ovintiv USA | 0 | 0 | 0 | $89.43 | $2.64 |
SourceTexas Railroad Commission Production Data Query, through Aug 2026. Prices: EIA.
How to check your stub against this lease Checks stopped on this lease? See the likely reasonsNearby
This lease belongs to
Ovintiv USA Inc. in Howard County
- ROGERS 39
535 bbl
- SMITH 30
341 bbl
- SHORTES 30
279 bbl
- LONG 14
283 bbl
- WYNN FARMS 28
343 bbl
- ETHERIDGE 29
241 bbl
- ELBERT LONG 18
211 bbl
- HURT 21
1 bbl
- NEWTON - LONG UNIT
5 bbl
- RINGNECK DOVE
2 bbl
Spraberry (Trend Area) field
- FORTY CALIBER 20-17
83 mcf
- SWEETIE PECK -A-
2 bbl
- SUGG "D"
75 mcf
- TOM A
59 mcf
- WILSON "A"
2 bbl
- SMITH-HALL A
1 bbl
- LUCY
1 bbl
- WOODY -K-
5 mcf
- WHIT 2
1 mcf
- WOODY -J-
1 mcf
Leases within 10 km
- HOLY GRAIL 6
0 bbl · 0.6 km
- NEWTON 43
0 bbl · 0.6 km
- LANGLEY 43
0 bbl · 0.6 km
- PHILLIPS 6
0 bbl · 0.8 km
- HOLY GRAIL 43
0 bbl · 0.8 km
- LONG 5
0 bbl · 0.9 km
- HOLY GRAIL 43 "A"
0 bbl · 1.1 km
- ZULA 1
3,648 bbl · 1.2 km
- HECKLER 5
0 bbl · 1.2 km
- JENKINS 6
0 bbl · 1.3 km
Drilling permits within 10 km
SOUTHEAST LUTHER/FUSSELMAN/UNIT #2602XR
new drill · Trek Resources, Inc. · Howard County · 9.3 km
Permit 0915418 · May 8, 2026
OLD TOM UNIT A 21-28 #4MH
new drill · horizontal · Surge Operating, LLC · Howard County · 8.4 km
Permit 0915126 · Apr 29, 2026
OLD TOM UNIT A 21-28 #3MH
new drill · horizontal · Surge Operating, LLC · Howard County · 8.4 km
Permit 0915124 · Apr 29, 2026
OLD TOM B 21-33 #6MH
new drill · horizontal · Surge Operating, LLC · Howard County · 8.6 km
Permit 0915129 · Apr 29, 2026
OLD TOM A 21-33 #5MH
new drill · horizontal · Surge Operating, LLC · Howard County · 8.6 km
Permit 0915127 · Apr 29, 2026