
RRC operator 000016
A & E Minerals, LLC
A & E Minerals, LLC reported 1,029 barrels of oil in the last 12 months.
Operator dossier
- Producing leases
- 1
- Counties
- 1
- Biggest county
- Harrison County
- Biggest field
- Bethany, Ne. (Lime 3850)
Get checks from A & E Minerals, LLC?
A family member owned minerals here?
Search their name: a family member who owned minerals hereWhere they work
This county
- Fields
- 1
- Data through
- Aug 2026
Where A & E Minerals, LLC has wells
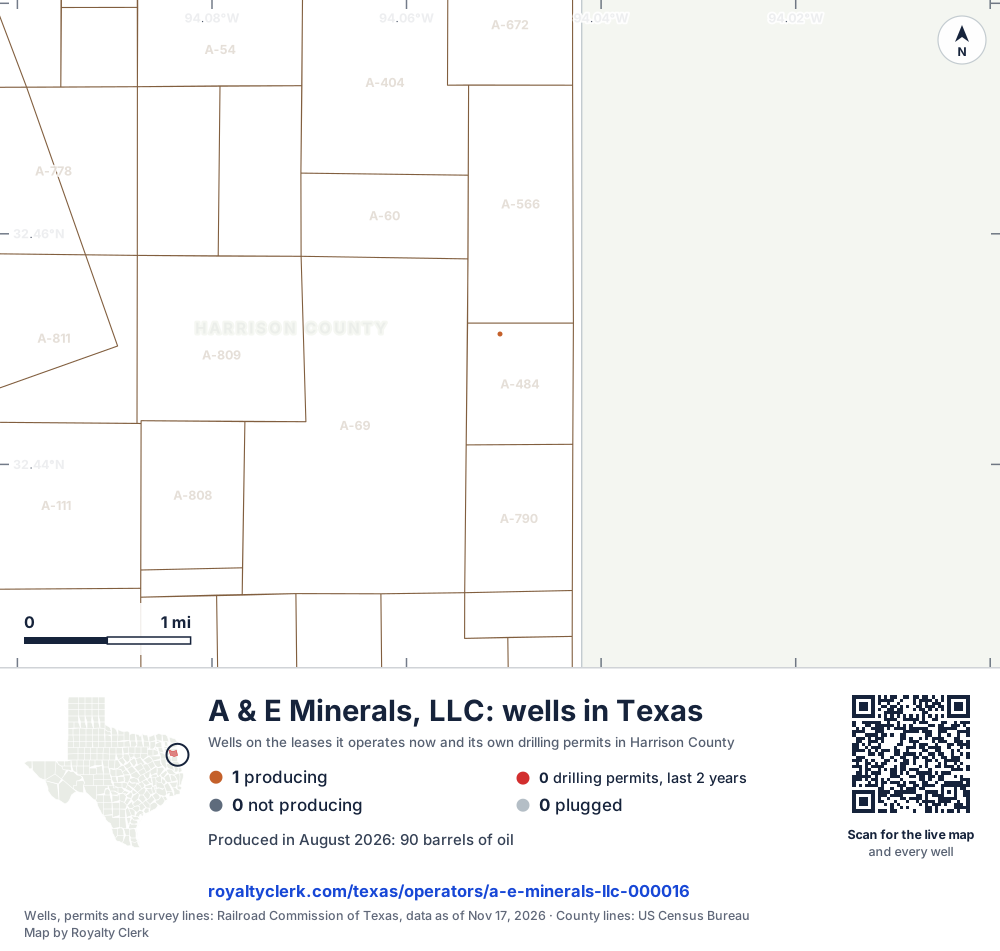
- Drilling locations0Permits issued in the last two years
- Producing wells1On a lease reporting production now
- Not producing0Shut in, inactive or no lease on record
- Plugged0The state's wellbore record says plugged
Each dot is a well on a lease A & E Minerals, LLC operates now, where the Railroad Commission's map puts it, or one of its drilling permits of the last 24 months. Wells of other operators are not on this map. The picture is about 6 miles across. The thin brown lines are the original land surveys; where there is room, a survey carries its abstract number, the number deeds and division orders cite. Sources: Railroad Commission of Texas well layers, drilling permit files and survey lines, US Census Bureau county outlines.
Use this map on your site
You may show this map on any site, unchanged. Keep the credit line and its link to Royalty Clerk under the map. The picture updates by itself as the state records new wells and permits.
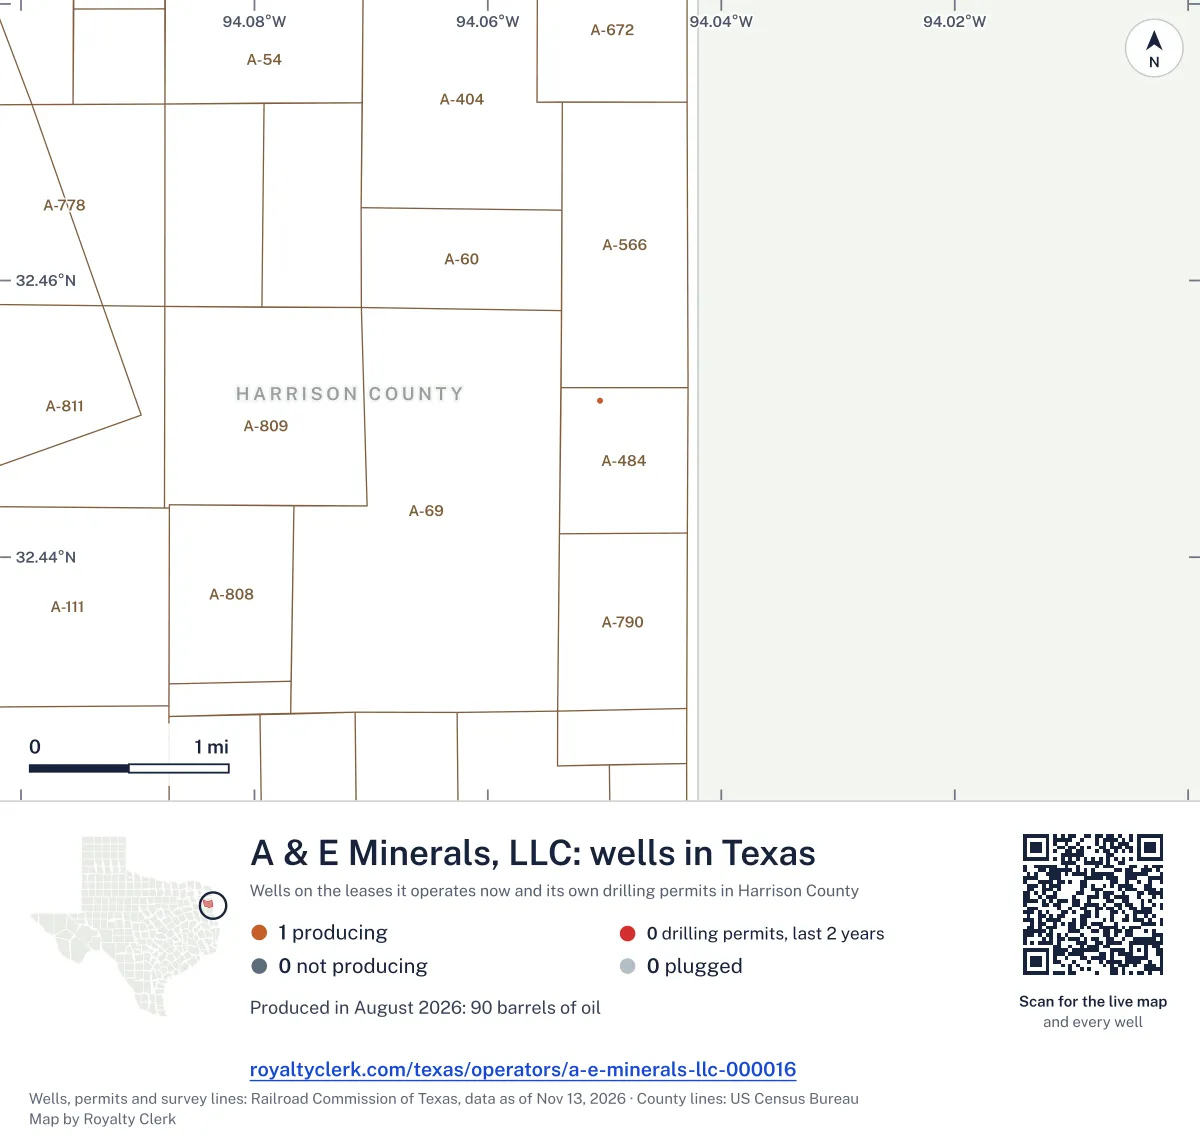
<a href="https://royaltyclerk.com/texas/operators/a-e-minerals-llc-000016"><img src="https://royaltyclerk.com/maps/operator-wells/a-e-minerals-llc-000016.svg" alt="Map of the wells of A & E Minerals, LLC in Texas: 1 well and 0 recent drilling locations, in a picture about 6 miles across." width="1000" height="951" loading="lazy" style="max-width:100%;height:auto;border:0"></a>
<p style="margin:4px 0 0;font-size:14px">Map: <a href="https://royaltyclerk.com/texas/operators/a-e-minerals-llc-000016">Oil and gas wells of A & E Minerals, LLC in Texas</a> by Royalty Clerk, from Railroad Commission of Texas records</p>Oil-led since 2020, with gas only in 2022 and 2023
A & E Minerals, LLC runs one producing lease in Texas, in Harrison County. Oil is its main product. Oil made more of its output than gas in every full calendar year from 2020 to 2025. Gas appears only in small amounts: 1 mcf in 2022 and 7 mcf in 2023, and none has been reported since. Its one lease is Whelan, its oldest producing lease, first reported in June 1996. The lease has one well, and that well is active. The well is not horizontal. Oil was 1,151 barrels in 2020, fell to 977 in 2021, and reached 1,097 in 2025.
Not a forecast, not reserves.
Key moments
- June 1996Whelan, its oldest producing lease, first reports production
- 2022First gas reported on its lease: 1 mcf
- 2023Gas reaches 7 mcf, the last gas reported on the lease
- 2024Oil falls to 982 barrels, down from 1,085 in 2023
- 2025Oil rises to 1,097 barrels, up from 982 in 2024
If you own here
- Who buys my oil and gas?
Whelan is its one producing lease, in Harrison County; the tool shows its buyers and since when.
- Why is my royalty check lower?
Its oil fell from 1,085 barrels in 2023 to 982 in 2024; the tool splits a drop into volume, price and deductions.
Questions owners ask
- Is Whelan the only lease this operator runs?
- The record shows one producing lease for A & E Minerals, LLC: Whelan, in Harrison County. The lease is in the Bethany, Ne. (Lime 3850) field. The lease has one well, and that well is active. The company reports oil on this lease, and no gas in the last 12 months.
- How much has its oil changed in the last 12 months?
- In the last 12 months the operator reported 1,016 barrels of oil. In the 12 months before, it reported 1,013 barrels. Oil rose 0.3%. It reported no gas in either period. Why is my royalty check lower?
- Does this operator drill new wells?
- The record shows one well on its leases, and it is active. None of its wells is horizontal, so the horizontal share is 0.0%. Its lease history goes back to June 1996, when Whelan first reported production.
- Which county and field is its oil from?
- All of its oil comes from Harrison County, in the Bethany, Ne. (Lime 3850) field. The county record shows 100.0% of its oil in Harrison County.
- Who buys the oil from its lease?
- The Railroad Commission lists the gatherers and buyers for each lease. For Whelan, the tool shows who buys the oil and since when. Who buys my oil and gas?
Related pages
- Harrison County
Harrison County, where all of its oil is reported
- Bethany, Ne. (Lime 3850)
The Bethany, Ne. (Lime 3850) field, its only field
- Whelan
Whelan, its oldest producing lease, first reported in June 1996
From the state's records through July 2026.
Five years of A & E Minerals, LLC output
Oil output from A & E Minerals, LLC held steady over the last 12 months
1,029 bbl through Aug 2026, against 1,010 bbl a year earlier. Peak Aug 2023: 145 bbl.
Gas output from A & E Minerals, LLC: 0 mcf in the last 12 months
0 mcf through Aug 2026. Peak Jan 2023: 7 mcf.
SourceTexas Railroad Commission Production Data Query, operator 000016, through Aug 2026, file dated Oct 20, 2026.
Its one producing lease, Whelan
Under each volume: change on the year before.
1,029bbl oil+2%
Showing 1 of 1.
SourceTexas Railroad Commission Production Data Query.
Recent drilling permits for A & E Minerals, LLC
No recent permits.
A & E Minerals, LLC address and phone number
This is the mailing address and phone A & E Minerals, LLC filed with the Texas Railroad Commission. It is the company’s address of record with the state. It can be a regulatory office and not the desk that pays royalties, so a letter about a payment should name the owner relations or division order department, your owner number and the lease name from your stub.
Mailing address
A & E Minerals, LLC2601 Centenary Blvd
Shreveport, LA 71104
Phone
State filing
RRC operator 000016 · P-5 status: Active · last filing received Sep 9, 2026
Writing about a missing or stopped check? See what to ask first or open the company record for its state registration and who buys its oil and gas.
SourceTexas Railroad Commission, P-5 Organization data, file dated Oct 22, 2026. Royalty Clerk is not affiliated with A & E Minerals, LLC.