
RRC operator 083236
Borger Resources 2 LLC
Borger Resources 2 LLC reported 6,611 barrels of oil and 81,542 mcf of gas in the last 12 months.
Operator dossier
- Producing leases
- 20of 37 on record
- Counties
- 3
- Biggest county
- Carson County
- Biggest field
- Panhandle, West
Get checks from Borger Resources 2 LLC?
A family member owned minerals here?
Search their name: a family member who owned minerals hereWhere they work
fewermore
- Gas, last 12 months
- 81,542 mcf
- Fields
- 3
- Data through
- Aug 2026
- Leases on record
- 37
Where Borger Resources 2 LLC has wells
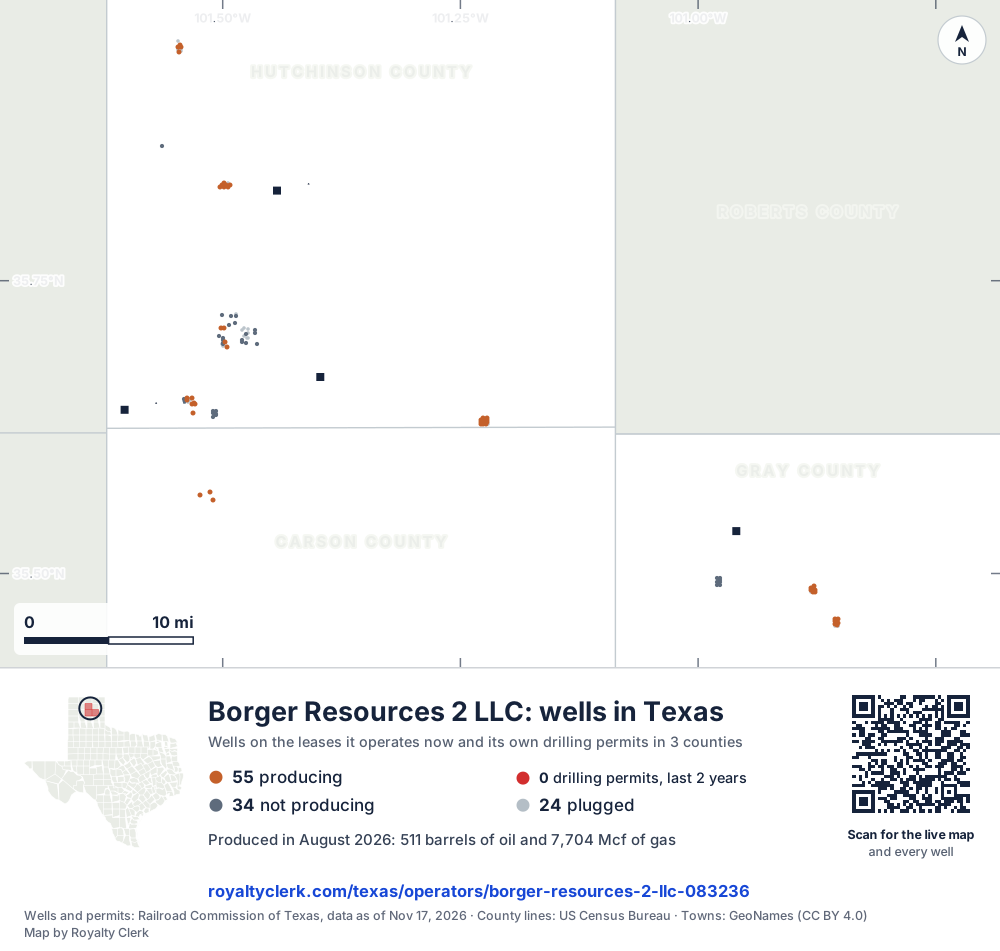
- Drilling locations0Permits issued in the last two years
- Producing wells55On a lease reporting production now
- Not producing34Shut in, inactive or no lease on record
- Plugged24The state's wellbore record says plugged
Each dot is a well on a lease Borger Resources 2 LLC operates now, where the Railroad Commission's map puts it, or one of its drilling permits of the last 24 months. Wells of other operators are not on this map. The picture is about 59 miles across. The white counties are the ones with a well or drilling permit of its own on the map. Three more wells have no location on the state's map. Sources: Railroad Commission of Texas well layers and drilling permit files, US Census Bureau county outlines, town points from GeoNames (CC BY 4.0).
Use this map on your site
You may show this map on any site, unchanged. Keep the credit line and its link to Royalty Clerk under the map. The picture updates by itself as the state records new wells and permits.
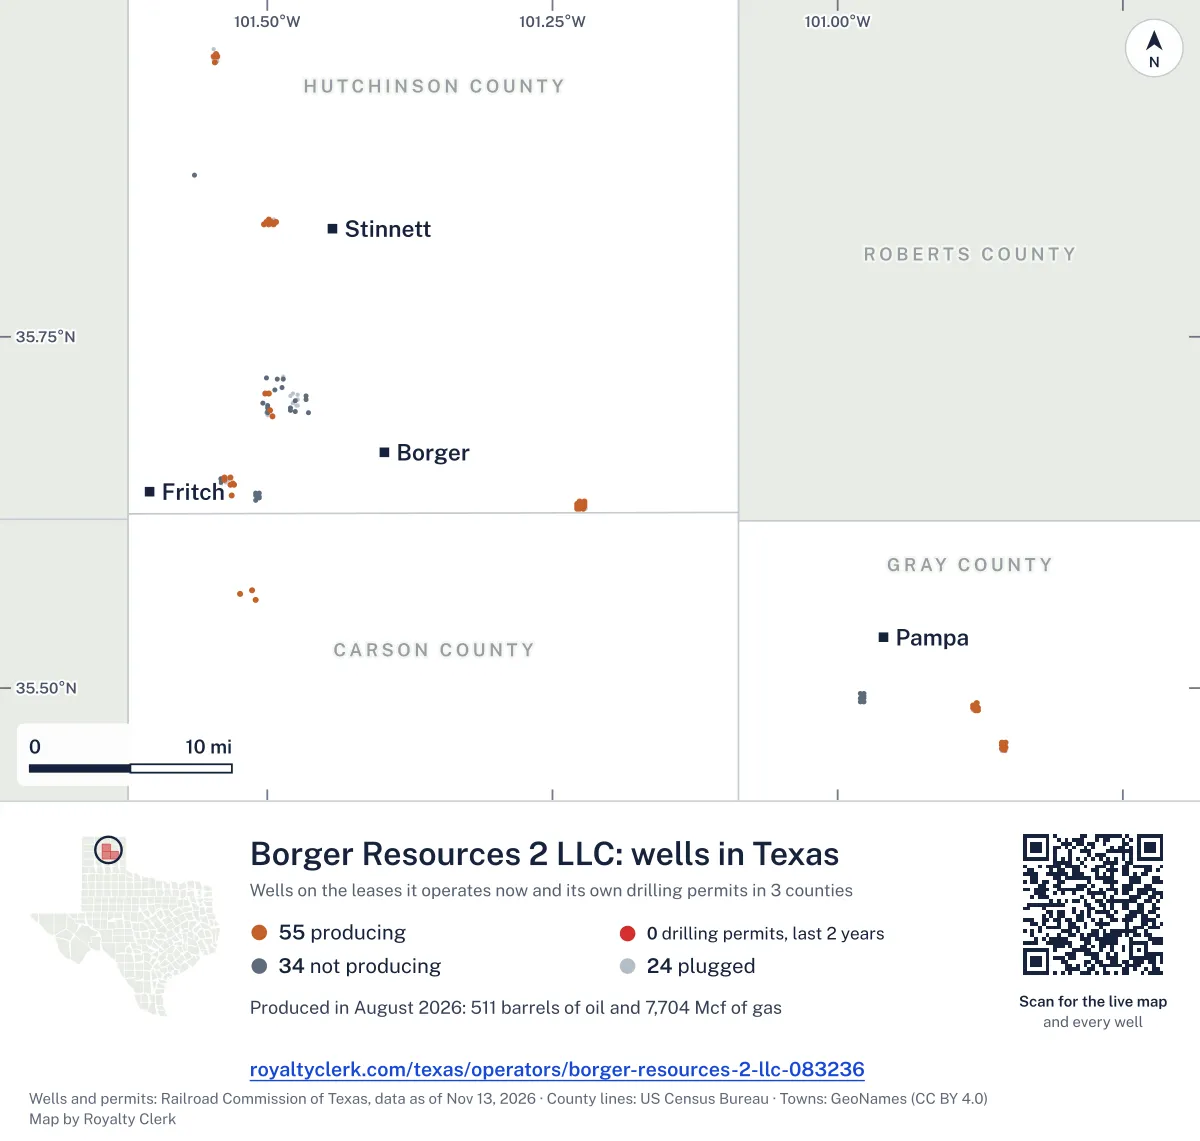
<a href="https://royaltyclerk.com/texas/operators/borger-resources-2-llc-083236"><img src="https://royaltyclerk.com/maps/operator-wells/borger-resources-2-llc-083236.svg" alt="Map of the wells of Borger Resources 2 LLC in Texas: 113 wells and 0 recent drilling locations, in a picture about 59 miles across." width="1000" height="951" loading="lazy" style="max-width:100%;height:auto;border:0"></a>
<p style="margin:4px 0 0;font-size:14px">Map: <a href="https://royaltyclerk.com/texas/operators/borger-resources-2-llc-083236">Oil and gas wells of Borger Resources 2 LLC in Texas</a> by Royalty Clerk, from Railroad Commission of Texas records</p>
Gas led its output in every full year
Gas led its output in every full calendar year from 2020 to 2025. Borger Resources 2 LLC makes more gas than oil, and Hutchinson County accounts for 59.5% of its gas.
Its oil reached 8,189 bbl in 2024, and its gas reached 102,033 mcf in 2023. In 2023 it also took over three leases, which the state shows by year.
None of its 129 wells is horizontal. Of those wells, 97 are active. 100.0% of its gas went to a gas line in the last 12 months.
Not a forecast, not reserves.
Key moments
- 2021Oil rose to 4,232 bbl while gas fell to 71,257 mcf.
- 2022Oil rose to 5,572 bbl and gas rose to 80,361 mcf.
- 2023Took over three leases; gas reached 102,033 mcf.
- 2024Oil reached 8,189 bbl; gas eased to 85,520 mcf.
- 2025Oil fell to 6,494 bbl and gas to 73,744 mcf.
If you own here
- Who buys my oil and gas?
Iacx Rock Creek LLC is listed as a buyer on 17 leases of this operator. The tool shows the buyers for your lease and since when.
- Old company, new payor
It took over three leases in 2023. The tool follows an old company's name changes and sales to the company that carries on today.
Questions owners ask
- Who buys the oil and gas from these leases?
- Iacx Rock Creek LLC is listed as a buyer on 17 leases. DCP Operating Company, LP is listed as a buyer on 3 leases. The state lists each lease's gatherers and buyers, and since when. Who buys my oil and gas?
- Why is gas a bigger part of this operator's output than oil?
- In every full calendar year from 2020 to 2025, gas made more of its output than oil did, counted in barrels of oil equivalent. Gas has been the larger share in each of those years.
- Why did this operator take over leases in 2023?
- The state shows it took over three leases in 2023. That year its gas reached 102,033 mcf and its oil reached 7,690 bbl. The tool below follows old company names and sales. Old company, new payor
- Which counties give this operator the most of its oil and gas?
- Hutchinson County accounts for 59.5% of its gas and 24.6% of its oil. Carson County accounts for 44.9% of its oil and 30.6% of its gas. Gray County accounts for 9.9% of its gas.
Related pages
- Hutchinson County
Hutchinson County accounts for 59.5% of its gas.
- Panhandle, West
Its field with 11 producing leases, the most gas in its list.
- Carson County
Carson County accounts for 44.9% of its oil.
- Foxx
Its oldest producing lease, first reported in January 1993.
From the state's records through July 2026.
Oil and gas by year, 2020 to 2026
Oil output from Borger Resources 2 LLC held steady over the last 12 months
6,611 bbl through Aug 2026, against 6,812 bbl a year earlier. Peak Apr 2024: 985 bbl.
Gas output from Borger Resources 2 LLC rose 12% over the last 12 months
81.5k mcf through Aug 2026, against 72.5k mcf a year earlier. Peak Sep 2023: 11.1k mcf.
SourceTexas Railroad Commission Production Data Query, operator 083236, through Aug 2026, file dated Oct 20, 2026.
Which leases it runs, biggest first
Under each volume: change on the year before.
1,569bbl oil−9%
612bbl oil+3%
13,345mcf gas−1%
12,202mcf gas+32%
11,292mcf gas+65%
438bbl oil−21%
6,552mcf gas−1%
263bbl oil−6%
215bbl oiln/a
4,368mcf gas0%
4,240mcf gas+27%
178bbl oil−41%
4,068mcf gas+32%
168bbl oil−5%
3,631mcf gas+31%
101bbl oil−58%
78bbl oil−77%
518mcf gas+27%
413mcf gas+26%
- HAGY
10-024887Hutchinson CountyPanhandle, West
192mcf gas+32%
Showing 20 of 20, ranked by output value.
SourceTexas Railroad Commission Production Data Query.
Which counties and fields it produces in
Counties, by Borger Resources 2 LLC oil
Carson County leads
Fields, by Borger Resources 2 LLC oil
Panhandle, West leads
Recent drilling permits for this operator
No recent permits.
Where the gas of Borger Resources 2 LLC went
- Plants
- 0.0%
- Pipelines
- 100%
- Lease fuel
- 0.0%
- Flared or vented
- 0.0%
SourceTexas Railroad Commission Production Data Query, last 12 months. What the codes mean
Borger Resources 2 LLC address and phone number
This is the mailing address and phone Borger Resources 2 LLC filed with the Texas Railroad Commission. It is the company’s address of record with the state. It can be a regulatory office and not the desk that pays royalties, so a letter about a payment should name the owner relations or division order department, your owner number and the lease name from your stub.
Mailing address
Borger Resources 2 LLC6 Cobblestone Ln
Borger, TX 79007-8406
Phone
State filing
RRC operator 083236 · P-5 status: Active · last filing received Mar 11, 2026
Writing about a missing or stopped check? See what to ask first or open the company record for its state registration and who buys its oil and gas.
SourceTexas Railroad Commission, P-5 Organization data, file dated Oct 22, 2026. Royalty Clerk is not affiliated with Borger Resources 2 LLC.