
RRC operator 674200
Powell Properties, Inc.
Powell Properties, Inc. reported 9,939 barrels of oil in the last 12 months.
Operator dossier
- Producing leases
- 8
- Counties
- 2
- Biggest county
- Garza County
- Biggest field
- Jones County Regular
Get checks from Powell Properties, Inc.?
A family member owned minerals here?
Search their name: a family member who owned minerals hereWhere they work
fewermore
- Fields
- 3
- Data through
- Aug 2026
Where Powell Properties, Inc. has wells
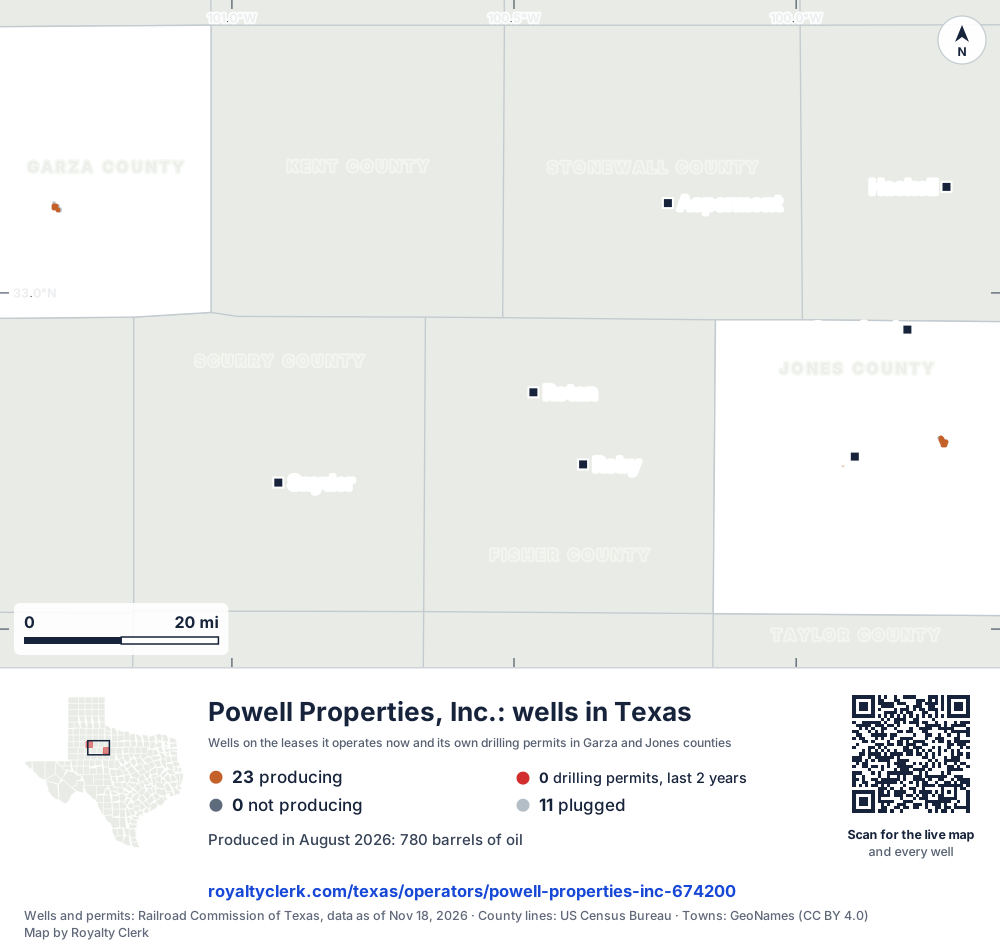
- Drilling locations0Permits issued in the last two years
- Producing wells23On a lease reporting production now
- Not producing0Shut in, inactive or no lease on record
- Plugged11The state's wellbore record says plugged
Each dot is a well on a lease Powell Properties, Inc. operates now, where the Railroad Commission's map puts it, or one of its drilling permits of the last 24 months. Wells of other operators are not on this map. The picture is about 103 miles across. The white counties are the ones with a well or drilling permit of its own on the map. Sources: Railroad Commission of Texas well layers and drilling permit files, US Census Bureau county outlines, town points from GeoNames (CC BY 4.0).
Use this map on your site
You may show this map on any site, unchanged. Keep the credit line and its link to Royalty Clerk under the map. The picture updates by itself as the state records new wells and permits.
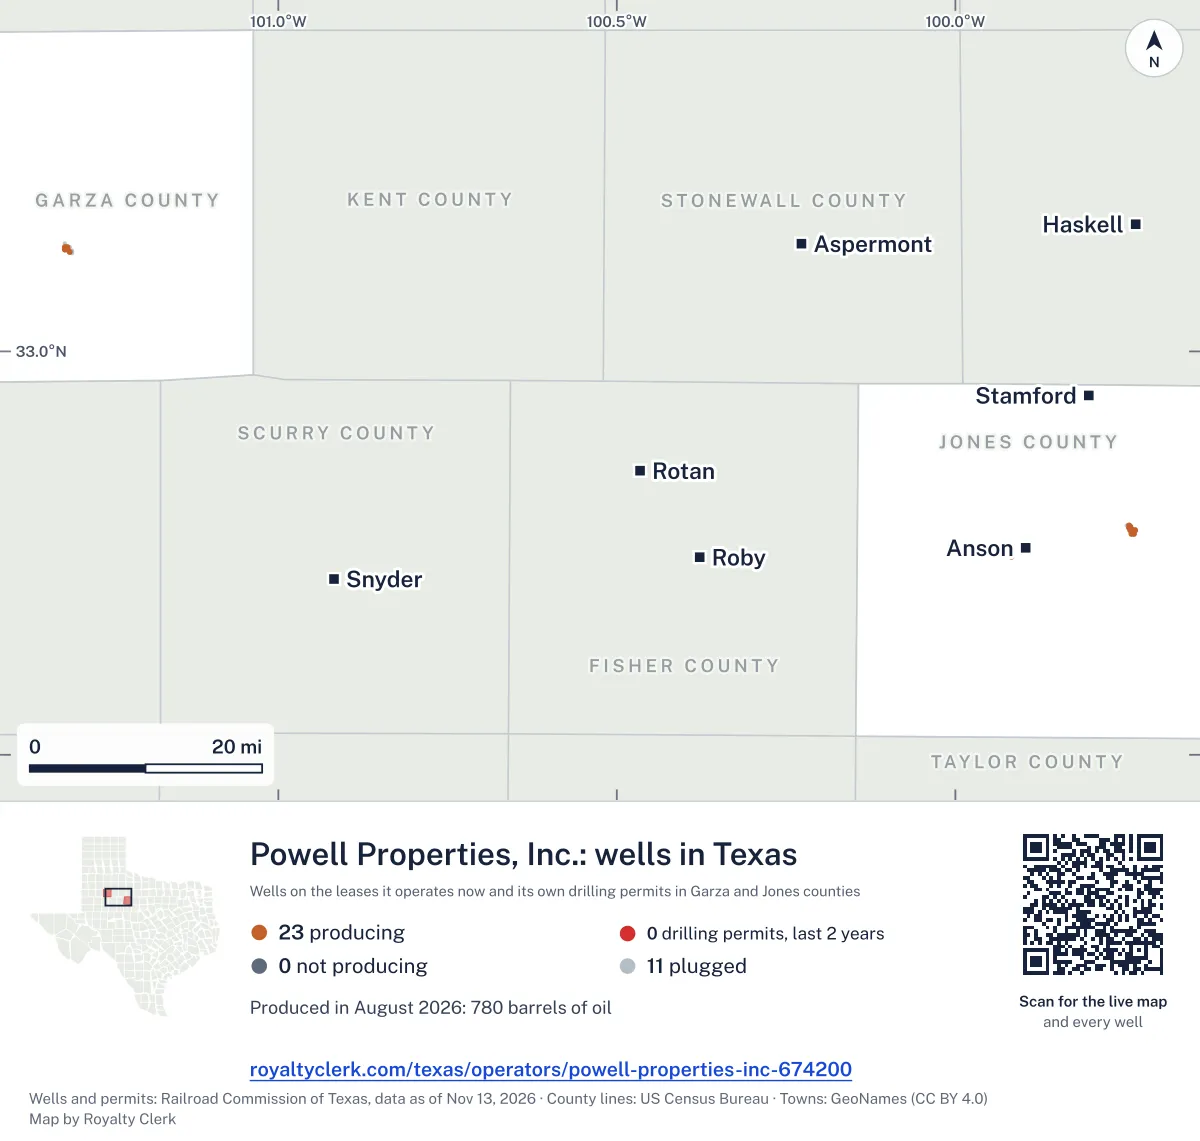
<a href="https://royaltyclerk.com/texas/operators/powell-properties-inc-674200"><img src="https://royaltyclerk.com/maps/operator-wells/powell-properties-inc-674200.svg" alt="Map of the wells of Powell Properties, Inc. in Texas: 34 wells and 0 recent drilling locations, in a picture about 103 miles across." width="1000" height="951" loading="lazy" style="max-width:100%;height:auto;border:0"></a>
<p style="margin:4px 0 0;font-size:14px">Map: <a href="https://royaltyclerk.com/texas/operators/powell-properties-inc-674200">Oil and gas wells of Powell Properties, Inc. in Texas</a> by Royalty Clerk, from Railroad Commission of Texas records</p>
Oil output has eased each year since 2021
Powell Properties, Inc. produces only oil, from 8 leases in Garza and Jones counties. Its 3 fields include Jones County Regular and two Rocker fields. No gas has been reported on its leases in any year shown.
Oil output rose from 11,533 barrels in 2020 to 12,363 in 2021. Each full year after 2021 shows less oil than the year before, ending at 9,602 barrels in 2025. The 2026 figure covers only months through July.
Of its 34 wells, 23 are active, and none is horizontal. Five of its leases have reports back to January 1993. Connell "A" is its oldest producing lease, first reported in January 1993.
Key moments
- 2021Oil output reached 12,363 barrels, with no gas reported on its leases.
- 2022Oil output fell to 12,008 barrels, the first drop after 2021.
- 2023Oil output fell to 10,653 barrels, down from 12,008 in 2022.
- 2025Oil output reached 9,602 barrels, the last full calendar year shown.
- July 2026Oil through July 2026 totals 5,810 barrels in a year not yet complete.
If you own here
- Operator price check
Its oil comes from 2 counties and 3 fields, so compare the oil price on a stub with what Texas buyers paid.
- When is my next check?
Its oil volumes are reported monthly through July 2026, the latest state data shown.
Questions owners ask
- Does this operator report any gas?
- No. The state records show no gas reported on its leases in any year shown, from 2020 through July 2026. Its reported output is oil only.
- How much has its oil output changed since 2021?
- Oil output was 12,363 barrels in 2021 and 9,602 barrels in 2025. Each full year after 2021 shows less oil than the year before. The 2026 figure covers months through July only.
- Which of its leases has the longest history in the records?
- Connell "A" is its oldest producing lease. The state records show its first reported production in January 1993. Five of its leases have reports back to January 1993.
Related pages
- Garza County
50.5% of its oil came from Garza County leases.
- Jones County
49.5% of its oil came from four producing Jones County leases.
- Jones County Regular
Four of its producing leases sit in this field.
- Rocker -A-, Nw.(san Andres, NW.)
Three producing leases and 4,748 barrels of oil in this field.
- Connell "A"
Its oldest producing lease, first reported in January 1993.
From the state's records through July 2026.
Oil and gas output month by month for five years
Oil output from Powell Properties, Inc. held steady over the last 12 months
9,939 bbl through Aug 2026, against 9,668 bbl a year earlier. Peak Dec 2021: 1,179 bbl.
SourceTexas Railroad Commission Production Data Query, operator 674200, through Aug 2026, file dated Oct 20, 2026.
Which leases Powell Properties runs, biggest first
Under each volume: change on the year before.
2,414bbl oil−6%
1,867bbl oil+13%
1,749bbl oil−12%
1,562bbl oil+49%
1,009bbl oil−6%
585bbl oil−16%
485bbl oil+10%
268bbl oil+24%
Showing 8 of 8.
SourceTexas Railroad Commission Production Data Query.
Where Powell Properties produces oil in Texas
Counties, by Powell Properties, Inc. oil
Garza County leads
Fields, by Powell Properties, Inc. oil
Jones County Regular leads
Recent drilling permits filed by Powell Properties
No recent permits.
Powell Properties, Inc. address and phone number
This is the mailing address and phone Powell Properties, Inc. filed with the Texas Railroad Commission. It is the company’s address of record with the state. It can be a regulatory office and not the desk that pays royalties, so a letter about a payment should name the owner relations or division order department, your owner number and the lease name from your stub.
Mailing address
Powell Properties, Inc.650B Fremont Ave No 377
Los Altos, CA 94024
Phone
State filing
RRC operator 674200 · P-5 status: Active · last filing received Feb 24, 2026
Writing about a missing or stopped check? See what to ask first or open the company record for its state registration and who buys its oil and gas.
SourceTexas Railroad Commission, P-5 Organization data, file dated Oct 22, 2026. Royalty Clerk is not affiliated with Powell Properties, Inc..