
RRC operator 739833
Ryan, Joseph G.
Ryan, Joseph G. reported 6,460 barrels of oil and 22,948 mcf of gas in the last 12 months.
Operator dossier
- Producing leases
- 5of 16 on record
- Counties
- 1
- Biggest county
- Baylor County
- Biggest field
- Chardonnay (Caddo)
Get checks from Ryan, Joseph G.?
A family member owned minerals here?
Search their name: a family member who owned minerals hereWhere they work
This county
- Gas, last 12 months
- 22,948 mcf
- Fields
- 5
- Data through
- Jul 2026
- Leases on record
- 16
Where Ryan, Joseph G. has wells
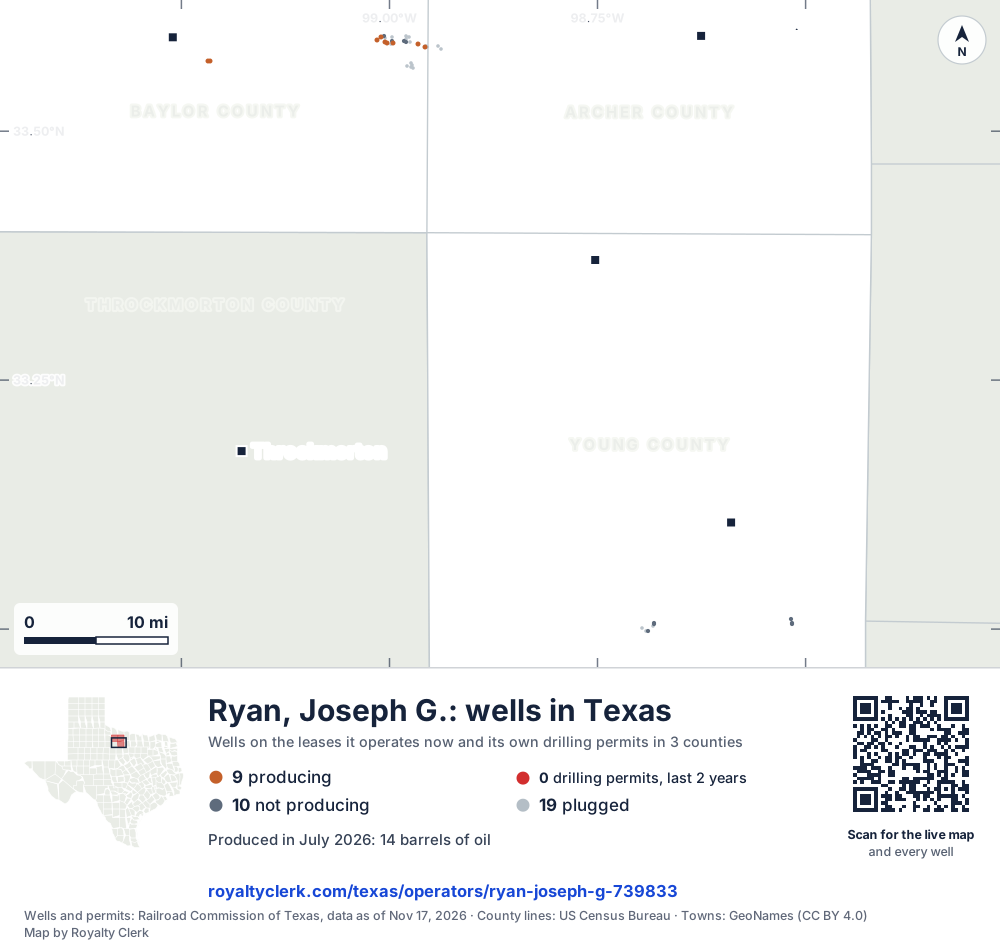
- Drilling locations0Permits issued in the last two years
- Producing wells9On a lease reporting production now
- Not producing10Shut in, inactive or no lease on record
- Plugged19The state's wellbore record says plugged
Each dot is a well on a lease Ryan, Joseph G. operates now, where the Railroad Commission's map puts it, or one of its drilling permits of the last 24 months. Wells of other operators are not on this map. The picture is about 69 miles across. The white counties are the ones with a well or drilling permit of its own on the map. Sources: Railroad Commission of Texas well layers and drilling permit files, US Census Bureau county outlines, town points from GeoNames (CC BY 4.0).
Use this map on your site
You may show this map on any site, unchanged. Keep the credit line and its link to Royalty Clerk under the map. The picture updates by itself as the state records new wells and permits.
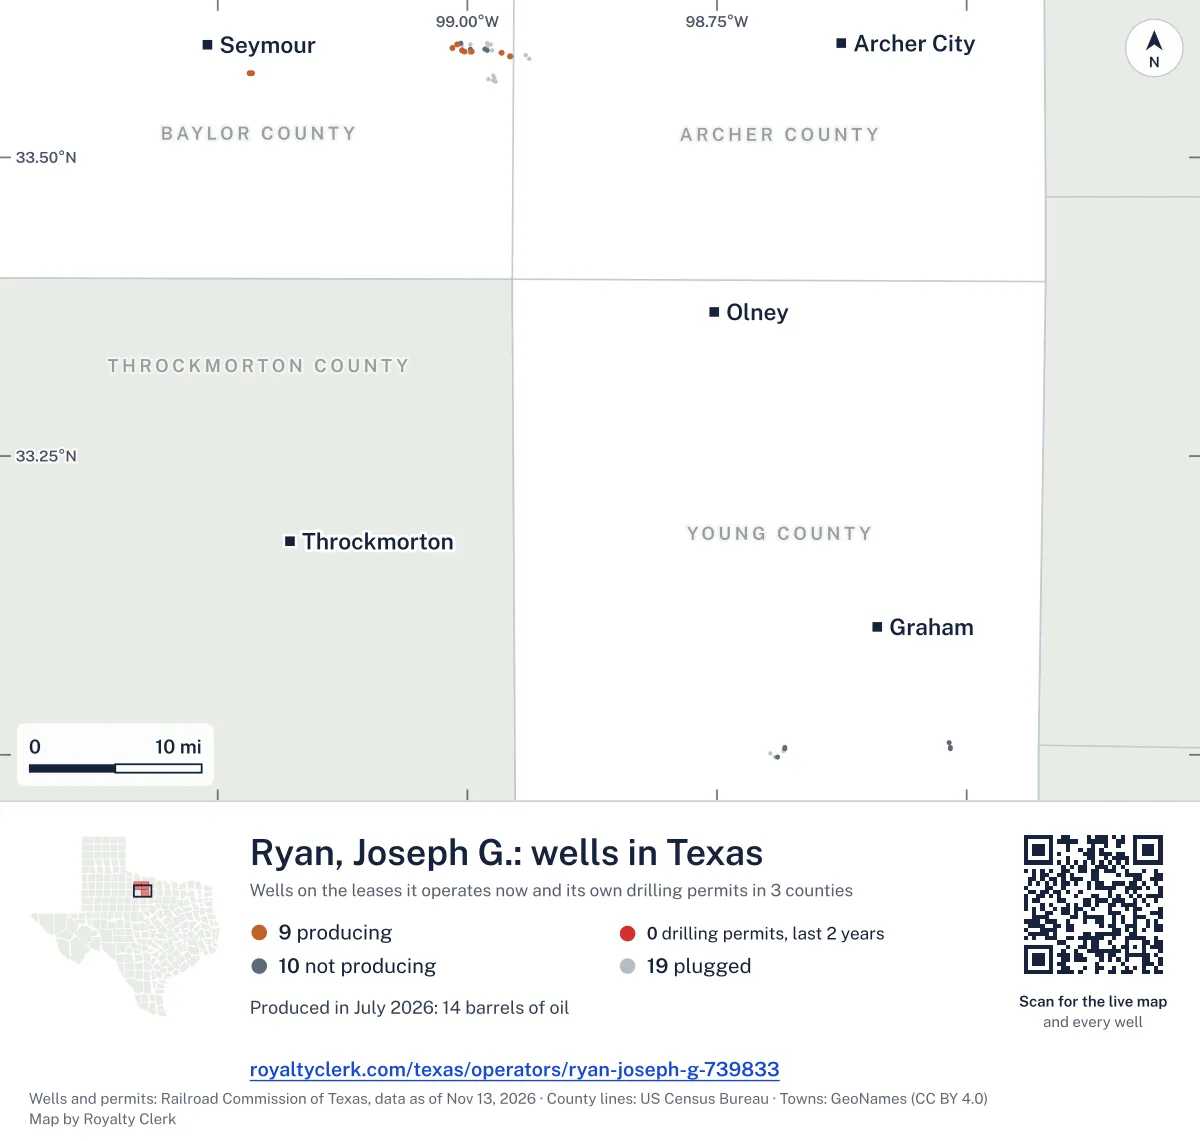
<a href="https://royaltyclerk.com/texas/operators/ryan-joseph-g-739833"><img src="https://royaltyclerk.com/maps/operator-wells/ryan-joseph-g-739833.svg" alt="Map of the wells of Ryan, Joseph G. in Texas: 38 wells and 0 recent drilling locations, in a picture about 69 miles across." width="1000" height="951" loading="lazy" style="max-width:100%;height:auto;border:0"></a>
<p style="margin:4px 0 0;font-size:14px">Map: <a href="https://royaltyclerk.com/texas/operators/ryan-joseph-g-739833">Oil and gas wells of Ryan, Joseph G. in Texas</a> by Royalty Clerk, from Railroad Commission of Texas records</p>
Gas output has fallen each year since 2021
Joseph G. Ryan runs 16 leases, and 5 of them are producing now, all in Baylor County. Oil made more of its output than gas in every full calendar year from 2020 to 2025, counted in barrels of oil equivalent. Gas has fallen every full year since 2021, from 38,819 mcf to 24,890 mcf in 2025. The operator took over five leases in 2023 and one more in 2024. Within the last 24 months it also handed 16 leases to Roil Operating LLC and 3 to R.j. Riley Operating, LLC. Its oldest producing lease, Livingston, F. L. "A", reports back to January 1993. Of its 47 wells, 22 are active and none are horizontal.
Not a forecast, not reserves.
Key moments
- 2021Gas reached 38,819 mcf, the most in the years shown.
- 2022Oil dipped to 8,053 bbl while gas held near 38,672 mcf.
- 2023Took over five leases from another operator; oil rose to 9,028 bbl.
- 2024Took over one more lease; oil reached 9,650 bbl, the most shown.
- 2025Oil fell to 7,559 bbl and gas to 24,890 mcf, both below 2024.
If you own here
- Old company, new payor
Handed 16 leases to Roil Operating LLC and 3 to R.j. Riley Operating, LLC in 24 months.
- Who buys my oil and gas?
It took over leases in 2023 and 2024; the buyer list shows who buys each lease's oil and gas.
Questions owners ask
- Who received leases handed off by this operator?
- Roil Operating LLC took 16 leases from this operator, and R.j. Riley Operating, LLC took 3, within the last 24 months. Check each lease's own page to see which company holds it now. Old company, new payor
- How many of its wells are active?
- The state lists 47 wells on its leases. Of those, 22 are active. None of the wells are horizontal, so the horizontal share is 0.0%.
- Which of its leases has reported the longest?
- Livingston, F. L. "A" is its oldest producing lease. Its monthly reports go back to January 1993, and the lease is producing now. Five of its 16 leases have had no report for 6 months.
Related pages
- Baylor County
All of its producing leases sit in Baylor County.
- Livingston, F. L. "A"
Its oldest producing lease, reporting back to January 1993.
- Chardonnay (Caddo)
The field where this operator reports the most oil, 40 bbl.
- Baylor County Regular
A Baylor County field where this operator reports 33 bbl of oil.
From the state's records through July 2026.
How oil and gas have moved over the last five years
Oil output from Ryan, Joseph G. fell 22% over the last 12 months
6,460 bbl through Jul 2026, against 8,241 bbl a year earlier. Peak May 2024: 952 bbl.
Gas output from Ryan, Joseph G. fell 7% over the last 12 months
22.9k mcf through Jul 2026, against 24.6k mcf a year earlier. Peak Mar 2022: 3,780 mcf.
SourceTexas Railroad Commission Production Data Query, operator 739833, through Jul 2026, file dated Oct 20, 2026.
Its 16 leases, biggest first
Under each volume: change on the year before.
40bbl oil−55%
33bbl oiln/a
15bbl oil−95%
11bbl oil−15%
2bbl oil−94%
Showing 5 of 5.
SourceTexas Railroad Commission Production Data Query.
Where it produces: Baylor County and five fields
Fields, by Ryan, Joseph G. oil
Chardonnay (Caddo) leads
- Chardonnay (Caddo)1 lease · District 09 · Field 1715220040bbl
- Baylor County Regular1 lease · District 09 · Field 0633400133bbl
- Boone (Caddo)1 lease · District 09 · Field 1056915015bbl
- Freeport (Caddo Lime)1 lease · District 09 · Field 3293633311bbl
- Seymour (Strawn)1 lease · District 09 · Field 824786662bbl
What recent drilling permits it has filed
No recent permits.