
RRC field 47941500 · District 09
KRS (Marble Falls)
The KRS (Marble Falls) field reported 3.2 million mcf of gas and 82,339 barrels of oil in the last 12 months.
Field dossier
- Producing leases
- 155of 456 on record
- Operators
- 20
- Counties
- 4
- Biggest operator
- Oakridge Oil and Gas, LP
Own minerals in this field?
A family member owned minerals here?
Search their name: a family member who owned minerals hereWhere the field sits
fewermore
- Oil, last 12 months
- 82,339 bbl
- Data through
- Jul 2026
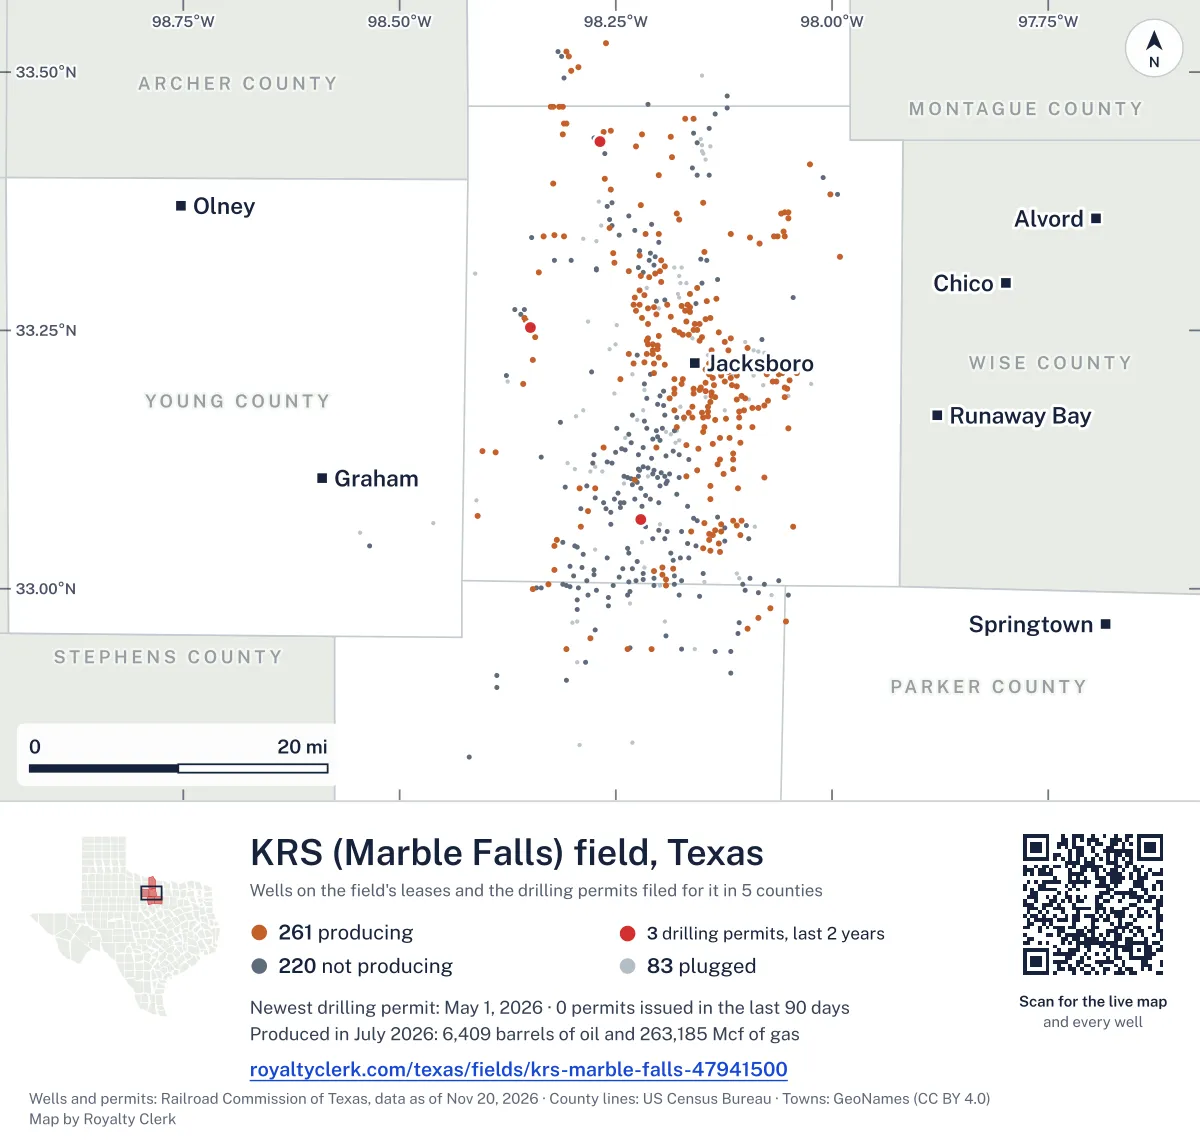
Wells in the KRS (Marble Falls) field

- Drilling locations3Permits issued in the last two years
- Producing wells261On a lease reporting production now
- Not producing220Shut in, inactive or no lease on record
- Plugged83The state's wellbore record says plugged
Each dot is a well on a lease the Railroad Commission lists in the KRS (Marble Falls) field, where its map puts it, or a drilling permit filed for the field in the last 24 months. Wells of other fields are not on this map. The picture is about 80 miles across. The white counties are the ones with a well or drilling permit of the field on the map. Sources: Railroad Commission of Texas well layers and drilling permit files, US Census Bureau county outlines, town points from GeoNames (CC BY 4.0).
Use this map on your site
You may show this map on any site, unchanged. Keep the credit line and its link to Royalty Clerk under the map. The picture updates by itself as the state records new wells and permits.
<a href="https://royaltyclerk.com/texas/fields/krs-marble-falls-47941500"><img src="https://royaltyclerk.com/maps/field-wells/krs-marble-falls-47941500.svg" alt="Map of the wells of the KRS (Marble Falls) field, Texas: 564 wells and 3 recent drilling locations, in a picture about 80 miles across." width="1000" height="951" loading="lazy" style="max-width:100%;height:auto;border:0"></a>
<p style="margin:4px 0 0;font-size:14px">Map: <a href="https://royaltyclerk.com/texas/fields/krs-marble-falls-47941500">Oil and gas wells of the KRS (Marble Falls) field, Texas</a> by Royalty Clerk, from Railroad Commission of Texas records</p>
How KRS (Marble Falls) grew from one lease to 420 in 2019
KRS (Marble Falls) is a field of 456 leases in four counties, and many of its leases began reporting from 2010 to 2019. Newark E&P Operating, LLC, Brigadier Operating, LLC and Atlas Barnett, LLC were the first operators on leases from 2010 to 2019.
Gas made more of the field's output than oil in every full calendar year from 2009 to 2025, except 2009. The biggest full year was 2015, with 1,056,496 barrels of oil and 23,771,516 mcf of gas. Leases reporting fell from 420 in 2019 to 185 in 2020, and 111 leases have stopped since 2020.
Today one operator, Oakridge Oil and Gas, LP, runs the largest share of the field's output.
Not a forecast, not reserves.
Key moments
- 201295 leases reporting, up from 26 the year before.
- 2015Biggest full year: 1,056,496 barrels of oil, 23,771,516 mcf gas.
- 2019420 leases reporting in the field.
- 2020Leases reporting fall to 185 from 420 the year before.
- 2025116 leases reporting; the latest full calendar year.
If you own here
- Find the land on my deed
Jack County holds 133 of the field's 155 producing leases. Find your section or abstract number on a survey map.
- Mineral interest finder
Leases here sit in Jack, Palo Pinto, Clay and Parker counties. The search checks a name across county mineral rolls.
- Gas royalty calculator
Gas made more of the field's output than oil in each full year from 2009 to 2025, except 2009.
Questions owners ask
- Why did the number of leases reporting fall after 2019?
- The state's records show 111 leases stopped reporting from 2020 on. Another 75 leases stopped before 2020. The field had 456 leases in all, and 155 are producing now.
- Who runs the leases in KRS (Marble Falls) now?
- Oakridge Oil and Gas, LP holds 52.2% of the field's barrels of oil equivalent. FX Energy Operating, LLC holds 29.6%, and G & F Oil, Inc. holds 5.7%. The field has 20 operators.
- Are new wells being permitted in this field?
- Operators filed 2 drilling permits in the last 12 months, and both are for horizontal wells. The field has 339 wells on producing leases, and 7 of them are horizontal, or 2.1%.
- How do I tell if my land is in this field?
- Find the section, block, survey or abstract number on your deed. The land-abstract search finds it on a survey map, with its wells and permits. Find the land on my deed
Related pages
- Oakridge Oil and Gas, LP
Holds 52.2% of the field's barrels of oil equivalent and 44 producing leases.
- FX Energy Operating, LLC
Holds 29.6% of the field's barrels of oil equivalent, with 36 producing leases.
- Eagleridge Operating, LLC
Holds 18 leases first reported from 2020 on, and 25 producing leases.
- Jack County
Jack County has 133 of the field's 155 producing leases.
- Halsell Ranch
Oldest producing lease here, with its first monthly report in October 2010.
From the state's records through July 2026.
Five years of output in KRS (Marble Falls)
Gas output in the KRS (Marble Falls) field fell 13% over the last 12 months
3.2M mcf through Jul 2026, against 3.6M mcf a year earlier. Peak Dec 2021: 509k mcf.
Oil output in the KRS (Marble Falls) field fell 22% over the last 12 months
82.3k bbl through Jul 2026, against 105k bbl a year earlier. Peak Nov 2021: 16.8k bbl.
SourceTexas Railroad Commission Production Data Query, field 47941500, through Jul 2026, file dated Oct 20, 2026.
Which leases here started and stopped, and when
Under each volume: change on the year before.
12,355bbl oil−12%
4,799bbl oil−63%
76,501mcf gas+8%
3,083bbl oil−4%
2,748bbl oil+18%
2,623bbl oil−38%
2,081bbl oil−16%
2,057bbl oil−47%
2,022bbl oil−18%
1,874bbl oil−18%
1,784bbl oil+25%
1,635bbl oil−8%
1,471bbl oil+35%
33,068mcf gas−15%
31,840mcf gas+6%
30,604mcf gas−20%
1,261bbl oil−10%
1,243bbl oil−24%
27,390mcf gas−3%
27,190mcf gas+2%
1,150bbl oil−25%
26,706mcf gas−27%
25,599mcf gas0%
1,095bbl oil−17%
1,065bbl oil−18%
Showing 25 of 150 (the 150 largest of 155), ranked by output value.
SourceTexas Railroad Commission Production Data Query.
Who runs the leases here, and in which counties
Operators, by gas
Oakridge Oil and Gas leads
- Oakridge Oil and Gas, LP44 leases1.7Mmcf
- FX Energy Operating, LLC36 leases947kmcf
- G & F Oil, Inc.13 leases147kmcf
- Eagleridge Operating, LLC25 leases143kmcf
- Borderline Operating Corp.2 leases38.8kmcf
- Rife Energy Operating, Inc.8 leases37.1kmcf
- B.o.l.d. Oil and Gas, LLC1 lease24.8kmcf
- Bowles Energy, Inc.3 leases22.8kmcf
Counties, by gas
Jack County leads
Drilling permits filed in the last 12 months
MESA BRISCOE LUCKY #7H
new drill · horizontal · G & F Oil, Inc. · Jack County
Permit 0915218 · May 1, 2026
HUGHES #1H
reclass · horizontal · FX Energy Operating, LLC · Jack County
Permit 0914302 · Mar 31, 2026
REDFEARN 3342 UNIT #1
new drill · Best Petroleum Explorations,inc. · Jack County
Permit 0904181 · Dec 6, 2024
SEWELL #14
recompletion · Oakridge Oil and Gas, LP · Jack County
Permit 0898413 · Apr 3, 2024
EDWARDS-WORTHINGTON 6 #6
new drill · Oakridge Oil and Gas, LP · Jack County
Permit 0794222 · Sep 8, 2014
EDWARDS-WORTHINGTON 3 #3
new drill · Oakridge Oil and Gas, LP · Jack County
Permit 0766195 · Jul 11, 2013