
Texas countyRailroad Commission district 7BThrough July 2026
Palo Pinto CountyTexas oil and gas
Palo Pinto County sold 63,033 barrels of oil and 3.18 billion cubic feet of gas in the last 12 months.
August 2026 is still coming in. About 89% of Texas leases have reported it so far, so this page counts through July 2026 until it is fully reported.
- Oil, last 12 months
- 63,033 bbl
- Gas, last 12 months
- 3.18 billion cu ft
- Producing leases
- 721 of 1,864
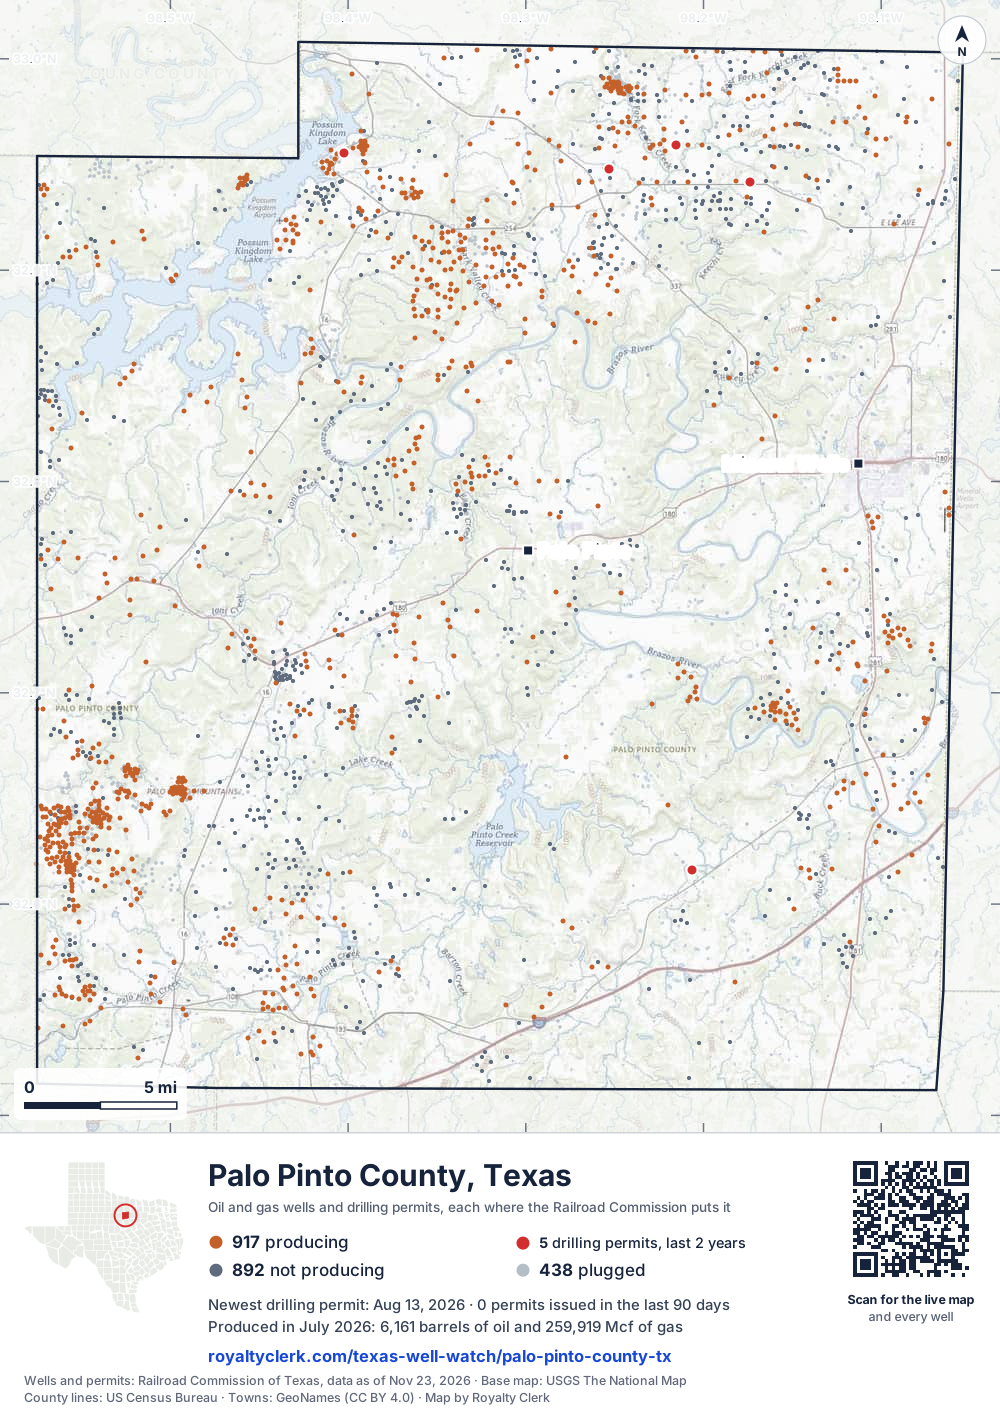
- Wells on the map
- 2,247
- Drilling locations, two years
- 5
- Wells on record
- 2,248
- Operators
- 74
- Top field
- Newark, East (Barnett Shale)
The story, from 403 months of reports
How operators changed hands in Palo Pinto County
- 1Gas county JANUARY 1993
- 2Most new wells SEPTEMBER 2008
Palo Pinto County is a gas county. Gas made more of its output than oil in every full calendar year from 1993 to 2025, and gas made about nine tenths of the county's output over the last 12 months: 89.4%.
The operators have changed often. Upham Oil & Gas Company led the county from 2001 to 2013, Dallas Production, Inc. from 2014 to 2018, and Arrowhead Productions, LP from 2019 to 2021. J-Tec Production, LLC led from 2022 to 2025. Eagleridge Operating, LLC leads in 2026 so far, with 83 leases.
Fewer leases report now. In 2010, 2,074 leases reported here; in 2025, 1,382 did. Many leases stopped reporting from 2019 on, with 170 stopping in 2023 alone. Only 2 leases started in 2025.
- 1995 Most oil of any full calendar year: 658,184 barrels.
- 2001 Upham Oil & Gas Company takes over 98 leases from Upham, Chester R., JR.
- 2008 Vantage Fort Worth Energy LLC takes over 107 leases from Telesis.
- 2009 Most gas of any full calendar year: 22,294,304 mcf.
- 2014 Dallas Production, Inc. leads again, with 130 leases.
- 2019 Arrowhead Productions, LP leads, with 105 leases.
- 2022 J-Tec Production, LLC leads, with 87 leases.
- 2026 Eagleridge Operating, LLC leads so far, with 83 leases.
State records through July 2026.
Not a forecast, not reserves.
219 producing counties, biggest first
114th in Texas for gas, 163rd for oil
Each line is one Texas county, drawn to what it sold in the last 12 months. Palo Pinto County is the blue one. In 1993 it was 164th for oil and 85th for gas.
of all Texas oil in the last 12 months.
of all Texas gas.
operators. The biggest is Texxol Operating Company, Inc..
fields. The biggest is Newark, East (Barnett Shale).
SourceTexas Railroad Commission Production Data Query, every county, August 2025 to July 2026.
For mineral owners, from the state record
What Palo Pinto County owners ask
- 01Who pays royalties in Palo Pinto County?
- Pk Gath & Oilfield Svcs, Inc.65Upham Oil & Gas Company47Stephens & Johnson Operating Co.46
- 74 operators run the county's producing leases. The one that pays you is the company named on your check stub. Pk Gath & Oilfield Svcs, Inc. runs the most leases, 65 of the 721.
- Source: Railroad Commission production reports, operator of record.
- Find the operator of your lease
- 02If oil or gas sold in July 2026, when would a regular check be due?
- Jul 31sale month endsSep 29oil dueOct 29gas due
- For a subsequent sale in July 2026, the usual Texas deadlines would be September 29, 2026 for oil and October 29, 2026 for gas. These are 60 and 90 days after month-end when the written agreement sets no payment schedule. First sales follow a different rule.
- Source: Railroad Commission production reports; Texas Natural Resources Code §91.402.
- See your next three checks
- 03Why did my Palo Pinto County check go down?
- Oil sold▲ 3.57%Oil price▲ 6.53%Gas sold▼ 1.79%Gas price▲ 17.5%
- Across the county, oil sold is up 3.57% on the 12 months before and the oil price is up 6.53%. In the same months gas sold is down 1.79% and the gas price up 17.5%. A check can move with the county's volume and the price with nothing wrong on the lease. The statement check tells the two apart.
- Source: Railroad Commission production reports; U.S. Energy Information Administration prices.
- Why is my check lower?
- 04How much of this county's output is gas?
- Gas made more of the county's output than oil in every full calendar year from 1993 to 2025. Over the last 12 months, gas made about nine tenths of the output, counted in barrels of oil equivalent: 89.4%. The royalty calculator estimates a check for a lease you own.
- Royalty calculator
- 05Who runs the leases here now?
- Eagleridge Operating, LLC leads the county in 2026 so far, with 83 leases. Texxol Operating Company, Inc. reported about a tenth of the county's oil and gas over the last 12 months: 10.4%. The 3 biggest operators reported 27.1%.
- 06How many leases reported here in 2025, compared with 2010?
- In 2025, 1,382 leases reported here, against 2,074 in 2010, the most of any full calendar year. That is about two thirds as many. In 2025, 107 operators filed reports here, against 207 in 1995.
- 07What happened to leases that stopped reporting after 2019?
- 170 leases stopped reporting in 2023, the most in any year shown. 120 stopped in 2021. Bulwark Oil & Gas, LLC shed 48 leases over the last 24 months, the most of any operator in that list.
- 08Do estate, heir or trust names appear on leases here?
- 43 leases in this county carry an estate, heirs or trust name. The mineral interest finder searches a name on Texas county mineral rolls for accounts, counties and leases.
- Mineral interest finder
403 months against seven other recordsNew
Every month since January 1993, and what else happened that month
The whole county is the line on top. Under it, on the same clock: the weather, the price, how many leases reported, new wells, takeovers, State cut-offs and leases that went silent. Move across it.
Gas averaged $4.19 an mcf · 751 leases reporting
- WeatherExtreme cold, February 18 to 21, 2025. Three days below 20°F in Palo Pinto County.
- Takeover16 leases changed operator in one month, 13 of them from Sage Natural Resources LLC to Eagleridge Operating, LLC.
- StateThe State cut off 42 leases' right to sell this month. The most common reason on file: Delinquent P-5 (organization report).
Move the pointer or drag across the chart. The numbered buttons jump to each month.
Monthly production of the whole county with seven aligned record tracks beneath it. Use the left and right arrow keys to move month by month.. 403 months from January 1993 to July 2026. The most in one month: 2.23 million mcf, October 2008. The newest month: 259,919 mcf. Moments marked: 1, Feb 2011; 2, May 2020; 3, Jun 2020; 4, Feb 2021; 5, Feb 2022; 6, Feb 2025.
SourcesProduction, leases, new wells, takeovers, cut-offs and silent leases: Railroad Commission of Texas, reported through July 2026. Weather: NOAA storm reports, record dated October 26, 2026. Prices: U.S. Energy Information Administration, through October 2026. An empty lane means nothing of that kind on the records read. A record in the same month is not proof of a cause.
Royalty Watch tells you the month your own lease starts to drop, with the records from that month.See Royalty Watch
34 years of state records, 1993 to 2026
Oil and gas by year, back to January 1993
$2.3billion
What the county's oil and gas sold for at each month's public prices, before tax and the operators' deductions.
- Oil sold
- 11.0 millionbarrels
- Gas sold
- 461 billioncubic feet
- Sold the most
- 2008$224.2 million sold
| Year | Oil, dollars | Gas, dollars | Total |
|---|---|---|---|
| 1993 | $5.5 million | $37 million | $42.5 million |
| 1994 | $6.5 million | $34.1 million | $40.6 million |
| 1995 | $12.1 million | $31.4 million | $43.5 million |
| 1996 | $10.5 million | $43.2 million | $53.8 million |
| 1997 | $10.4 million | $43.3 million | $53.7 million |
| 1998 | $9.3 million | $35.9 million | $45.3 million |
| 1999 | $5.8 million | $34.8 million | $40.6 million |
| 2000 | $12.2 million | $65 million | $77.3 million |
| 2001 | $11.4 million | $58.6 million | $70 million |
| 2002 | $9.1 million | $47.6 million | $56.7 million |
| 2003 | $8.4 million | $75.9 million | $84.3 million |
| 2004 | $17.6 million | $83.5 million | $101.2 million |
| 2005 | $16.4 million | $128.4 million | $144.9 million |
| 2006 | $14.6 million | $104.9 million | $119.6 million |
| 2007 | $16.2 million | $97.2 million | $113.5 million |
| 2008 | $52.9 million | $171.2 million | $224.2 million, sold the most |
| 2009 | $37.8 million | $88.1 million | $125.9 million |
| 2010 | $38.4 million | $90.3 million | $128.8 million |
| 2011 | $36.2 million | $71.4 million | $107.6 million |
| 2012 | $33.9 million | $45 million | $79 million |
| 2013 | $48.8 million | $66.2 million | $115.1 million |
| 2014 | $48.5 million | $80.4 million | $129 million |
| 2015 | $18.5 million | $44.7 million | $63.2 million |
| 2016 | $9.5 million | $31.7 million | $41.2 million |
| 2017 | $8.9 million | $32.4 million | $41.3 million |
| 2018 | $10.6 million | $31.3 million | $41.9 million |
| 2019 | $7.9 million | $23.1 million | $31.1 million |
| 2020 | $3.8 million | $11.7 million | $15.5 million |
| 2021 | $6.2 million | $19.1 million | $25.3 million |
| 2022 | $7.6 million | $31.7 million | $39.3 million |
| 2023 | $5.2 million | $10.5 million | $15.8 million |
| 2024 | $5.1 million | $7.2 million | $12.3 million |
| 2025 | $3.9 million | $11.4 million | $15.3 million |
| 2026, to July | $3.1 million | $6.7 million | $9.9 million |
For research and teaching
Source: Royalty Clerk analysis of Texas Railroad Commission filings, https://royaltyclerk.com/texas/counties/palo-pinto-county-tx, data to July 2026.
Palo Pinto County oil and gas by year, 1993 to 2026
| Year | Oilbbl | Gasmcf | Sold forat that month's prices |
|---|---|---|---|
| 2026, to July | 36,914 | 1,833,501 | $9.9 million |
| 2025 | 60,217 | 3,248,283 | $15.3 million |
| 2024 | 66,567 | 3,305,516 | $12.3 million |
| 2023 | 68,214 | 4,161,187 | $15.8 million |
| 2022 | 79,778 | 4,912,953 | $39.3 million |
| 2021 | 91,002 | 4,962,261 | $25.3 million |
| 2020 | 96,537 | 5,830,699 | $15.5 million |
| 2019 | 140,063 | 9,045,370 | $31.1 million |
| 2018 | 163,148 | 9,955,273 | $41.9 million |
| 2017 | 175,582 | 10,855,189 | $41.3 million |
| 2016 | 224,728 | 12,763,736 | $41.2 million |
| 2015 | 378,603 | 16,909,061 | $63.2 million |
| 2014 | 519,213 | 18,374,625 | $129 million |
| 2013 | 498,212 | 17,765,471 | $115.1 million |
| 2012 | 362,106 | 16,383,689 | $79 million |
| 2011 | 382,574 | 17,812,489 | $107.6 million |
| 2010 | 486,629 | 20,669,490 | $128.8 million |
| 2009 | 653,664 | 22,294,304 | $125.9 million |
| 2008 | 617,569 | 19,813,175 | $224.2 million |
| 2007 | 224,393 | 13,952,252 | $113.5 million |
| 2006 | 221,407 | 15,565,558 | $119.6 million |
| 2005 | 292,904 | 14,438,266 | $144.9 million |
| 2004 | 426,187 | 14,162,355 | $101.2 million |
| 2003 | 270,174 | 13,888,775 | $84.3 million |
| 2002 | 352,567 | 14,164,125 | $56.7 million |
| 2001 | 439,615 | 14,692,897 | $70 million |
| 2000 | 404,615 | 15,049,054 | $77.3 million |
| 1999 | 308,270 | 15,360,680 | $40.6 million |
| 1998 | 632,124 | 17,160,768 | $45.3 million |
| 1997 | 510,518 | 17,344,487 | $53.7 million |
| 1996 | 482,928 | 18,903,255 | $53.8 million |
| 1995 | 658,184 | 19,510,413 | $43.5 million |
| 1994 | 378,970 | 18,056,542 | $40.6 million |
| 1993 | 300,129 | 17,718,667 | $42.5 million |
SourcesRailroad Commission Production Data Query, every monthly report since January 1993. EIA monthly WTI and Henry Hub prices, and the Texas wellhead gas price before 1997. 2026 is part of a year, drawn lighter. Not a forecast, not reserves.
Royalty interests
The county mineral roll
No mineral roll for Palo Pinto County is loaded here yet, so this page has nothing from the roll to show.
SourceThe list of county appraisal district mineral rolls loaded here, and the Royalty Clerk estate study. Checked for Palo Pinto County. Record dated November 9, 2026.
The mineral interest finder searches every roll loaded here by family name, and links the appraisal districts it cannot search.Search a family name
721 producing leases
Which leases here are biggest now
Most gas leases here are small. The bars count the county's gas leases by how much gas each sold in the last 12 months. Find your lease and its bar turns blue.
Search, sort and filter the 150 biggest leases
Under each volume: change on the year before.
7,304bbl oil−40%
116,729mcf gas+12%
4,988bbl oil−8%
104,762mcf gas−8%
4,247bbl oil−21%
4,102bbl oil−9%
3,977bbl oil+125%
3,289bbl oil+122%
74,417mcf gas+375%
62,340mcf gas+159%
2,320bbl oil+238%
45,776mcf gas+69%
45,070mcf gas−15%
44,730mcf gas+29%
1,890bbl oil−5%
43,462mcf gas+8%
40,803mcf gas+22%
1,739bbl oil+6%
1,728bbl oil+165%
1,718bbl oil+113%
1,540bbl oil+12%
34,538mcf gas−6%
30,604mcf gas−20%
27,735mcf gas−4%
27,640mcf gas+11%
Showing 25 of 150 (the 150 largest of 721), ranked by output value.
SourceTexas Railroad Commission Production Data Query, through July 2026. 1,143 more leases are on record and not producing.
74 operators, 177 fields
Who runs the leases, and what they produce
Which operators produce the most here now
- 1Texxol Operating Company, Inc.358,404mcf21 leases · 11.3% of the county's gas
- 2Stephens & Johnson Operating Co.278,073mcf46 leases · 8.75% of the county's gas
- 3Eagleridge Operating, LLC231,747mcf21 leases · 7.29% of the county's gas
- 4Incendium Resources LLC218,408mcf15 leases · 6.87% of the county's gas
- 5Upham Oil & Gas Company201,815mcf47 leases · 6.35% of the county's gas
- 6FX Energy Operating, LLC187,669mcf14 leases · 5.91% of the county's gas
Which fields produce the most here now
- 1Newark, East (Barnett Shale)300,326mcf23 leases · 9.45% of the county's gas · District 09 · Field 65280200
- 2Burns-Dalton(marble Falls)295,929mcf30 leases · 9.31% of the county's gas · District 7B · Field 13764500
- 3Scatter (Bend)221,491mcf2 leases · 6.97% of the county's gas · District 7B · Field 81400300
- 4Palo Pinto Co. Reg. (Gas)219,728mcf88 leases · 6.91% of the county's gas · District 7B · Field 68707333
- 5KRS (Marble Falls)167,514mcf12 leases · 5.27% of the county's gas · District 09 · Field 47941500
- 6Strawn, NW. (Marble Falls)82,733mcf18 leases · 2.60% of the county's gas · District 7B · Field 86577200
- 7Palo Pinto County Regular68,382mcf25 leases · 2.15% of the county's gas · District 7B · Field 68707001
- 8B.r.a. (Congl.)65,633mcf17 leases · 2.07% of the county's gas · District 7B · Field 04809500
- 9Mallory (Strawn)13,403mcf16 leases · 0.42% of the county's gas · District 7B · Field 56978800
Recent drilling permits and who filed them
| Lease and well | Operator | Filed as | Permit | Approved |
|---|---|---|---|---|
| COFFEE GROUP K.L. BRIDGES 9 | G & F Oil, Inc. | New drill | 0917649 | Aug 13, 2026 |
| HOOPER EAST 1 | FX Energy Operating, LLC | Recompletion | 0914050 | Mar 13, 2026 |
| JAGGERS 'A' N 2 | FX Energy Operating, LLC | Recompletion | 0913093 | Jan 27, 2026 |
| CATHODIC PROTECTION 34 | Atmos Pipeline - Texas | New drill | 0911399 | Nov 14, 2025 |
| EUBANKS, T.H. 7 | Antle Operating, Inc. | New drill | 0911129 | Oct 20, 2025 |
| WILLINGHAM 3 | Eagleridge Operating, LLC | Recompletion | 0902353 | Sep 20, 2024 |
Gas, July 2026, dollars per thousand cubic feetNew
What gas sold for in July 2026, and what the tax office has on file
Each operator tells the Texas Comptroller the price it got for each lease. Those prices have not reached our records for Palo Pinto County yet, so this part shows the market price and what the operators' parent companies told their investors. Each lease page shows its own price once the Comptroller's records arrive.
The State approved a lower tax on 648 of the 721 leases
- LOW PRODUCING WELLS
- 611 leases
- LOW PRODUCING LEASES
- 34 leases
- TWO YEAR INACTIVE WELL
- 21 leases
- TWO YEAR INACTIVE WELL
- 5 leases
- Rate, gas
- 0%
7.50% - Newest approval
- October 2026
89.9% of the county's producing leases
On those leases the tax line on a statement should show the lower rate. Each lease page says which wells and until when.
Your statement: the price on your own check stub for a Palo Pinto County lease is the one to set beside the market, the operator's and the tax office's. Check my statement
SourcesMarket: U.S. Energy Information Administration, Henry Hub. Tax approvals: Texas Comptroller. Leases sell at different points and qualities, so prices differ for ordinary reasons too.
Watch Plus sets these prices beside the price on each of your statements, every month.See Watch Plus
Who buys the gasNew
Who buys Palo Pinto County's gas
The State lists who buys from each lease. Company filings and the State's operator records show which companies are linked. Each bar is one operator's gas, split by buyer, and every split is an estimate: this record split a lease's gas evenly among its buyers where the P-4 gives no percent, and does not say which splits those are, so no share of the county's gas is stated.
SourcesBuyers and gatherers: Railroad Commission Form P-4 records, record dated October 24, 2026, weighted by each lease's gas sold in the 12 months to July 2026. Links: U.S. Securities and Exchange Commission filings and the Railroad Commission's P-5 organization reports. A link marks one buyer under one operator, never the rest of a lease's or the county's gas. This record does not show that each buyer and operator pair here was checked for a link, so a buyer not marked is not known to be unrelated. The other 60 operators are counted in the totals and not drawn.
Royalty Watch tells you the day the buyer of your oil or gas changes.See Royalty Watch
Night observations
Heat seen from space and flaring reported
The records read for 2025 hold 0 lease months in Palo Pinto County with night heat matched to a lease. That is a count of recorded matches, not a finding of no heat: satellite coverage of these pads is not established, and heat matched elsewhere in the region or in Texas does not establish it. Below, from a separate record, is where the county's gas went in 2025, as the operators reported it to the Railroad Commission.
Where the county's gas went in 2025, as operators reported it
SourceNOAA open data: VIIRS active fire readings at night from NOAA-20, NOAA-21 and Suomi NPP (a GOES-East reading alone never counts as a night), and Railroad Commission gas-disposition records. Checked for Palo Pinto County. Source date unavailable.
Watch Plus checks whether you were paid on gas in the months heat was seen at your lease.See Watch Plus
Permits, drilling and fracsNew
4 wells on the way
The State approved 5 drilling locations here in two years. These are the wells still between a permit and a first month of production, one dot for each, at the stage the records showed on November 17, 2026.
Approved, not started
Newest approval: Aug 13Being drilled
Spudded in the 30 days to Nov 17Drilled, no frac on record yet
No wait to countFracked, waiting on a report
No wait to countCompletion filed, no production yet
Middle wait: 241 daysSourcesPermits, drilling dates and completions: Railroad Commission of Texas. Frac dates: FracFocus chemical disclosure registry. Counted November 17, 2026. Newest permit on file for this county: August 13, 2026.
Royalty Watch tells you the day a well on your lease moves to its next stage.See Royalty Watch
Watch Private tells you when a permit or frac is recorded within a mile of your land.See Watch Private
See new drilling on the mapFull well mapPut this map on your site
Do your Palo Pinto County checks match the State?
Own minerals here? Add your leases to My leases and see your share of every month.
Example
A whole month was never paid
The State shows 28,175 barrels of oil sold from the lease in the month its operator changed from Operator A to Operator B, so the owner's share is 27.51 barrels. No statement covers that month.
Ask Operator B's owner relations: is that month held in suspense after the change of operator?
$2,277oil and gas
A sample finding, from our example check.
Around this county
Nearby
Where it sits
This county
Towns
- Palo Pinto574 wells within 10 miles
- Mineral Wells382 wells within 10 miles
Fields
- Mallory (Strawn)16 leases
- Palo Pinto County Regular25 leases
- Burns-Dalton(marble Falls)30 leases
- Newark, East (Barnett Shale)23 leases
- KRS (Marble Falls)12 leases
Newest drilling permits
- COFFEE GROUP K.L. BRIDGES 9New drill · approved Aug 13 · G & F Oil, Inc.
- HOOPER EAST 1Recompletion · approved Mar 13 · FX Energy Operating, LLC
- JAGGERS 'A' N 2Recompletion · approved Jan 27 · FX Energy Operating, LLC
- CATHODIC PROTECTION 34New drill · approved Nov 14 · Atmos Pipeline - Texas
- EUBANKS, T.H. 7New drill · approved Oct 20 · Antle Operating, Inc.
More on Palo Pinto County
- Every lease in Palo Pinto County, A to Z1,805 lease pages, listed 100 to a page.
- Every operator in Palo Pinto County162 operators with leases here, the biggest first.
- Palo Pinto County drilling permitsThe newest permits, completions and first production, free.
- Texas operators, A to ZEvery operator with producing leases, and its report card.
- Check a stub against a leaseMatch the barrels and mcf on your stub to the state record.
- Texxol Operating Company, Inc.Top operator here, with 10.4% of output over the last 12 months.
- Stephens & Johnson Operating Co.46 producing leases here; 78 leases on record still reporting.
- Eagleridge Operating, LLCLeads the county in 2026 so far, with 83 leases.
- Upham Oil & Gas CompanyLed the county from 2001 to 2013; 72 leases still reporting.
- Burns-Dalton(marble Falls)Top field now, with 30 producing leases and both oil and gas.
- Newark, East (Barnett Shale)23 producing leases; reports on record since August 2001.
Where this page comes from
- Railroad Commission of Texas production, Form P-4, permits, wells, cut-offs
- Texas Comptroller tax approvals
- U.S. Energy Information Administration prices
- SEC EDGAR company filings
- FracFocus frac dates
- NOAA storms and cold
- U.S. Census Bureau county shapes