
Texas gas fieldField 54647080District 7BThrough August 2026
Lonesome Duffer (Duffer)Stephens and Palo Pinto counties
The Lonesome Duffer field sold 98.8 million cubic feet of gas and 17 barrels of oil in the last 12 months, from 20 leases in two counties.
In this photoBrakaSurface spot, no path on record
The story, from 370 months of reports
How the Lonesome Duffer grew from one lease to 20
Lonesome Duffer (Duffer) is a gas field with 20 producing leases in Stephens and Palo Pinto counties. Gas made more of the field's output than oil in every full calendar year from 1995 to 2025. Braka Operating, L.L.C. runs most of it, with 84.7% of the field's barrels of oil equivalent.
Braka Operating's first reports cover 19 leases from 2000 to 2009. Stephens & Johnson Operating Co. reported the oldest producing lease, Stuart, Ellen G. "B", from October 1995. Leases reporting rose to 24 in 2011, then fell to 2 in 2020.
Only 2 leases have reported in each full year since 2020. None of the field's 20 wells is horizontal, and the state shows 7 leases stopped before 2020.
Not a forecast, not reserves.
Key moments
- 1997Biggest full calendar year: 1,379 bbl of oil and 632,650 mcf of gas.
- 200312 leases report, and oil reaches 5,216 bbl in the year.
- 201124 leases report production; gas is 178,217 mcf that year.
- 2020Leases reporting fall to 2, from 24 the year before.
SourceRailroad Commission production reports for every lease filed under field 54647080, November 1995 to August 2026. What the field has sold. Not a forecast, not reserves. Reported through August 2026.
Where the field sits
24 wells across two counties
Every well the State files under the Lonesome Duffer, drawn where its records put it. A well with a recorded bottom hole has a line to it. Wells with only a surface location appear as points. Colour the map by the company that operates each well, by how deep it runs, or see where drilling is headed.
BrakaStephens & Johnson
2 operators. Each has a colour. Tap a pad to see whose it is, or pick a county.
About 9 miles from west to east
What is on the map
Drilling locations: counted from the map as it loads
Leases by county
Wells near a town
Open the full well map

- Drilling locations0Permits issued in the last two years
- Producing wells20On a lease reporting production now
- Not producing4Shut in, inactive or no lease on record
- Plugged0The state's wellbore record says plugged
Each dot is a well on a lease the Railroad Commission lists in the Lonesome Duffer (Duffer) field, where its map puts it, or a drilling permit filed for the field in the last 24 months. Wells of other fields are not on this map. The picture is about 22 miles across. The white counties are the ones with a well or drilling permit of the field on the map. The thin brown lines are the original land surveys; where there is room, a survey carries its abstract number, the number deeds and division orders cite. Sources: Railroad Commission of Texas well layers, drilling permit files and survey lines, US Census Bureau county outlines.
Use this map on your site
You may show this map on any site, unchanged. Keep the credit line and its link to Royalty Clerk under the map. The picture updates by itself as the state records new wells and permits.
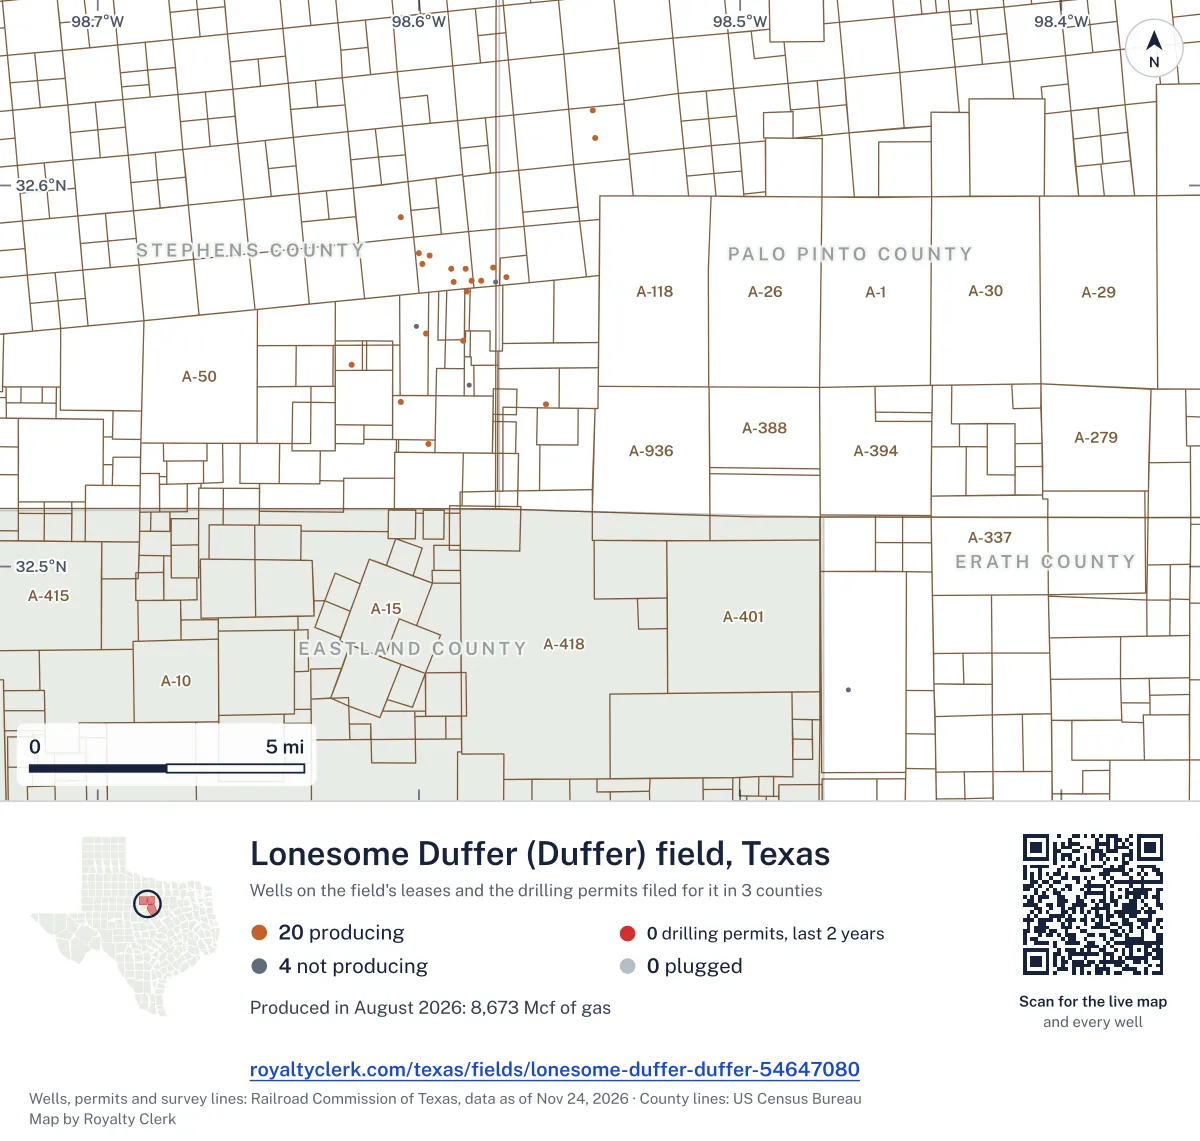
<a href="https://royaltyclerk.com/texas/fields/lonesome-duffer-duffer-54647080"><img src="https://royaltyclerk.com/maps/field-wells/lonesome-duffer-duffer-54647080.svg" alt="Map of the wells of the Lonesome Duffer (Duffer) field, Texas: 24 wells and 0 recent drilling locations, in a picture about 22 miles across." width="1000" height="951" loading="lazy" style="max-width:100%;height:auto;border:0"></a>
<p style="margin:4px 0 0;font-size:14px">Map: <a href="https://royaltyclerk.com/texas/fields/lonesome-duffer-duffer-54647080">Oil and gas wells of the Lonesome Duffer (Duffer) field, Texas</a> by Royalty Clerk, from Railroad Commission of Texas records</p>SourcesWells, well paths, operators, permits and drilling dates: Railroad Commission of Texas. Map depth bands: true vertical depth from FracFocus. County lines: U.S. Census Bureau. The dashed line is drawn around the wells; the State keeps no outline for a field. Record dated November 17, 2026. Roll-up counted November 18, 2026.
Watch Private covers the land around yours: it tells you the day a permit or a frac lands within a mile.See Watch Private
From each well's Railroad Commission recordNew
Total depth along the wellbore
Total depth measures the full length of the drilled hole, including bends and horizontal sections. Each tick is one well's total depth on its completion record, shallowest first. The field summary has no true vertical depth from FracFocus.
24 wells have a total depth on record, from 3,370 to 4,400 feet as filed; the middle of them is 4,076 feet. Each tick is one well.
feet: the middle of the completed total depths on record, along the hole as filed. That is 0.77 miles of hole.
feet: the deepest completed total depth on record.
wells have a completed total depth on record: every well on the field's leases.
Why no rock names: the State's well records give a well's total depth in feet and file the well under its field, not under the rock layer it produces from. So the drawing marks depths, never formations.
SourcesCompleted depth: the total depth on each well's own Railroad Commission well record, matched by API number whatever lease lists the well, one per API number, in whole feet as filed. Completed April 27, 1995 to April 1, 2009 (the earliest completion date on each well's record). 24 of the field's 24 wells have a completed total depth on record; a well without one is not drawn.
For mineral owners, from the state record
What Lonesome Duffer owners ask
- 01What is the Lonesome Duffer field?
- Lonesome Duffer (Duffer) is the name the Railroad Commission files these leases under: field 54647080, district 7B. The State files every lease under a field. The field on your statement names the rock your wells produce from, not the town they are near.
- Source: Railroad Commission of Texas field list, field 54647080, district 7B.
- See wellbore depths
- 02Is my lease in the Lonesome Duffer?
- Stephens County18Palo Pinto County4
- 20 leases report to this field, in Stephens and Palo Pinto counties. A lease can report to two fields when its wells reach different rock, and then it has a page under each. Another 4 leases are on record and not producing. Search the lease name on your check stub to see which fields it reports to.
- Source: Railroad Commission production reports, field of record for each lease.
- Find my lease
- 03Who pays royalties in the Lonesome Duffer?
- Braka Operating, L.L.C.20Stephens & Johnson Operating Co.2
- 2 operators reported production from the field in the last 12 months. The one that pays you is the company named on your check stub. Braka Operating, L.L.C. runs all 20 producing leases.
- Source: Railroad Commission production reports, operator of record.
- See all 2 operators
- 04Why did my Lonesome Duffer check go down?
- Oil sold▼ 80.0%Oil price▲ 10.4%Gas sold▼ 9.22%Gas price▲ 14.3%
- Across the field, oil sold is down 80.0% on the 12 months before and the oil price is up 10.4%. In the same months gas sold is down 9.22% and the gas price up 14.3%. A check can move with the field's volume and the price with nothing wrong on the lease. The statement check tells the two apart.
- Source: Railroad Commission production reports; U.S. Energy Information Administration prices.
- Why is my check lower?
- 05Who runs the leases in this field now?
- Braka Operating, L.L.C. runs 18 producing leases here and holds 84.7% of the field's barrels of oil equivalent. Stephens & Johnson Operating Co. runs 2 producing leases, with 15.3%. Both names come from the state's operator records for this field.
- 06What happened to the leases reporting here in 2020?
- Leases reporting fell to 2 in 2020, from 24 the year before. The state records show 7 leases stopped before 2020. Each full year from 2020 through 2025 shows 2 leases reporting. Gas kept reporting through 2025, the last full year shown.
- 07Which lease here has reported production the longest?
- The oldest producing lease is Stuart, Ellen G. "B", lease 155952. Stephens & Johnson Operating Co. is its operator. Its first reported month is October 1995. A survey or abstract search can find where it sits on the map.
- Find the land on my deed
- 08Are any wells in this field horizontal?
- 0 located, unplugged wells are recorded as horizontal. 24 other located, unplugged wells have no filed path classification.
- Railroad Commission well and completion records. Roll-up counted November 18, 2026.
- See the mapped wells
- 09How much gas did this field make in its biggest full calendar year?
- Its biggest full calendar year was 1997. The field made 1,379 bbl of oil and 632,650 mcf of gas that year. In the last 12 months, the field made 99,490 mcf of gas. Gas is measured in mcf, thousand cubic feet.
- Gas royalty calculator
370 months against seven other recordsNew
Every month since November 1995, and what else happened that month
The whole field is the line on top. Under it, on the same clock: the weather, the price, how many leases reported, new wells, takeovers, State cut-offs and leases that went silent. Move across it.
Gas averaged $2.78 an mcf · 20 leases reporting
- PriceThe oil price fell 19.8% the month before, to $80.46 a barrel.
Move the pointer or drag across the chart. The numbered buttons jump to each month.
Monthly gas sold from the Lonesome Duffer (Duffer) field since November 1995, with the record tracks beneath it on the same clock. 370 months from November 1995 to August 2026. The most in one month: 93,242 mcf, December 1996. The newest month: 8,673 mcf. Moments marked: 1, Apr 1996; 2, May 1997; 3, Aug 1997; 4, Dec 1997; 5, Mar 1998; 6, Aug 2003.
SourcesProduction, leases, new wells, takeovers, cut-offs and silent leases: Railroad Commission of Texas. Weather: NOAA Storm Events (file dated Oct 26, 2026) and NOAA daily county lows observed through Feb 21, 2026. Prices: U.S. Energy Information Administration (WTI for oil, Henry Hub for gas). Nothing on record in these months for: takeovers. A record in the same month is not proof of a cause. Reported through August 2026. Roll-up counted November 18, 2026.
Royalty Watch tells you the month your own lease starts to drop, with the records from that month.See Royalty Watch
32 years of state records, 1995 to 2026
Sold since November 1995
$26.5 million
What the field's oil and gas sold for at each month's public prices, before tax and the operators' deductions.
- Oil sold
- 31,273barrels
- Gas sold
- 6.24 billioncubic feet
- Best year
- 2008$2.5 million sold
| Year | Oil, dollars | Gas, dollars | Total |
|---|---|---|---|
| 1995, to August | $3,000 | $114,000 | $118,000 |
| 1996 | $36,000 | $1.1 million | $1.2 million |
| 1997 | $29,000 | $1.5 million | $1.5 million |
| 1998 | $2,000 | $563,000 | $566,000 |
| 1999 | $0 | $385,000 | $385,000 |
| 2000 | $0 | $511,000 | $511,000 |
| 2001 | $41,000 | $456,000 | $498,000 |
| 2002 | $74,000 | $661,000 | $735,000 |
| 2003 | $157,000 | $1.2 million | $1.4 million |
| 2004 | $118,000 | $1.2 million | $1.4 million |
| 2005 | $101,000 | $1.9 million | $2 million |
| 2006 | $262,000 | $1.4 million | $1.7 million |
| 2007 | $242,000 | $1.8 million | $2.1 million |
| 2008 | $202,000 | $2.3 million | $2.5 million, sold the most |
| 2009 | $35,000 | $915,000 | $950,000 |
| 2010 | $29,000 | $861,000 | $890,000 |
| 2011 | $29,000 | $708,000 | $738,000 |
| 2012 | $58,000 | $601,000 | $660,000 |
| 2013 | $22,000 | $627,000 | $650,000 |
| 2014 | $31,000 | $715,000 | $746,000 |
| 2015 | $17,000 | $416,000 | $433,000 |
| 2016 | $9,000 | $339,000 | $349,000 |
| 2017 | $16,000 | $468,000 | $485,000 |
| 2018 | $2,000 | $421,000 | $424,000 |
| 2019 | $10,000 | $363,000 | $374,000 |
| 2020 | $4,000 | $281,000 | $286,000 |
| 2021 | $11,000 | $553,000 | $565,000 |
| 2022 | $18,000 | $841,000 | $860,000 |
| 2023 | $10,000 | $343,000 | $354,000 |
| 2024 | $9,000 | $274,000 | $284,000 |
| 2025 | $4,000 | $366,000 | $371,000 |
| 2026, to August | $0 | $234,000 | $234,000 |
For research and teaching
Royalty Clerk. “Lonesome Duffer (Duffer) field, Texas.” Data through August 2026, from Railroad Commission of Texas filings. royaltyclerk.com/texas/fields/lonesome-duffer-duffer-54647080.
SourcesRailroad Commission Production Data Query, every monthly report since November 1995. EIA monthly WTI and Henry Hub prices. 2026 is part of a year, drawn lighter. Not a forecast, not reserves. Reported through August 2026.
Lease output over 12 months
Which of the 24 leases are producing now?
Most reporting leases are in the smaller size groups. The bars show 22 leases that reported oil or gas during the 12 months through August 2026, grouped by gas output. Pick a lease in the table to highlight its group. The table draws from the 20 leases counted as currently producing based on recent state filings.
Showing 20 of 20.
Search every Texas leaseSourceTexas Railroad Commission Production Data Query, field 54647080, through August 2026, file dated Oct 20, 2026. 4 more leases are on record and not producing.
2 operators, two counties
Who runs the field and in which counties
Each box is one operator's gas from one county in the last 12 months, drawn to size. The two biggest operators keep the colours they have on the map.
By gas in the last 12 months
- 1Braka Operating, L.L.C.83,670mcf20 leases · 84.7% of the field's gas · Palo Pinto, Stephens
- 2Stephens & Johnson Operating Co.15,089mcf2 leases · 15.3% of the field's gas · Palo Pinto
SourceTexas Railroad Commission Production Data Query, operator of record for each lease, through August 2026. Record dated October 20, 2026.
Gas prices and taxNew
The State approved a lower tax on 19 of the 20 leases
an mcf, Henry Hub, the average of the 12 months through August 2026, up 14.3% on the 12 before.
The tax office's price for each lease of this field shows here once the Comptroller's records for it arrive. Leases sell at different points and qualities, so their prices differ from the market for ordinary reasons too.
Lower tax approvals in this field
- LOW PRODUCING WELLS
- 19 leases
- TWO YEAR INACTIVE WELL
- 2 leases
- Newest approval
- December 2023
95.0% of the field's producing leases
On those leases the tax line on a statement should show the lower rate. Each lease page says which wells and until when.
Henry Hub, the 12 months through August 2026
No operator here reports a price to investors on file.
Not on file here yet. It shows once the Comptroller's records for this field arrive.
The price on your own check stub, set beside these three. Check my statement
SourcesMarket: U.S. Energy Information Administration, Henry Hub. Tax approvals: Texas Comptroller. A lease shows only where the Comptroller's records have arrived. Reported through October 2026. Roll-up counted November 18, 2026.
Watch Plus sets these prices beside the price on each of your statements, every month.See Watch Plus
Who buys the gasNew
24 leases with a gas purchaser on file
Each bar is one operator's gas allocated to its current buyer rows, split by buyer. Shares use reported production and the State's Form P-4.
No company filing on file here names a buyer and its operator in the same company, so whether they share an owner is unknown, not none. Buyers as of the Form P-4 record dated Oct 24, 2026.
Form P-4 filings and how the shares are calculated
Each lease's reported production over the field's last 12 months is allocated by the buyer's percent on the Form P-4; where no percent is filed, the lease's current buyers are given equal shares, an estimate. This is an allocation, not a sales record or a metered volume: where a lease has some percents filed and some missing, its allocations can add to more than its production. A lease with no current buyer on file is not counted, so these shares are of the 98,759 mcf allocated across current buyer rows, not of the whole field.
Where the State's P-5 records show the buyer and the operator with an officer or an address in common, the row says so. That is not common ownership.
Gas purchasers
24 leases across 24 current entries on Form P-4.
- RANGER GAS GATHERING, L.L.C. · 21 leases
- COLT G & P (NORTH TEXAS) L.P. · 3 leases
Common ownership with the operator is unconfirmed in the company records checked.
Latest P-4 source dateGas purchasers buy casinghead gas or gas-well gas. Oil gatherers collect oil for transport. Each lease counts once in each role, even if several companies or gas products are listed. The company lists show up to five parties by lease count. A lease can appear under more than one company.
SourcesAllocation bars: Railroad Commission Form P-4 current purchaser rows, with each lease's reported production over the last 12 months (Railroad Commission production reports) allocated by the buyer's filed percent, or an equal split of the lease where none is filed; only gas on leases with a current buyer on file is counted. An allocation, not a sales record. Ownership: U.S. Securities and Exchange Commission filings and State organization reports. Record dated October 24, 2026. Roll-up counted November 18, 2026.
Royalty Watch tells you the day the buyer of your oil or gas changes.See Royalty Watch
Seen from space, 2025New
No matched night observations on file for the field's leases
Weather satellites pass over Texas every night and record heat on the ground. No night observation in 2025 is matched to this field's leases on file here, and the satellites' coverage of these wells is unverified, so this is not a finding that there was no heat.
Where the field's gas went in 2025, as operators reported it
SourcesHeat: VIIRS active fire readings at night from NOAA-20, NOAA-21 and Suomi NPP (NOAA open data), matched to a lease's wells; a GOES-East reading alone never counts as a night. Satellite record read to Nov 17, 2026. Reported flaring and gas use: Railroad Commission production reports. Cloud hides heat, so the count is a floor. The satellite records heat. It does not say what burned. Roll-up counted November 18, 2026.
Watch Plus checks whether you were paid on gas in the months heat was seen at your lease.See Watch Plus
Well stages
Wells between permit and first production
A comparison of permits, drilling and fracs is unavailable for this field. No drilling permit for this field is among the State permit records read here.
SourceRailroad Commission drilling permits and FracFocus. Checked for the Lonesome Duffer field. Source date unavailable. Roll-up counted November 18, 2026.
Royalty Watch tells you the day a well on your lease moves to its next stage.See Royalty Watch
Do your Lonesome Duffer checks match the State?
Own minerals here? Add your leases to My leases and see your share of every month.
Example
A whole month was never paid
The State shows 28,175 barrels of oil sold from the lease in the month its operator changed from Operator A to Operator B, so the owner's share is 27.51 barrels. No statement covers that month.
Ask Operator B's owner relations: is that month held in suspense after the change of operator?
$2,277oil and gas
A sample finding, from our example check.
Around this field
Nearby
Fields nearby
- Stephens County Regular178 leases
- Stephens County Regular (Gas)111 leases
- Caddo (Duffer)56 leases
- Pitz (Duffer)42 leases
- Lilly Bell (Congl.)34 leases
Towns
- Ranger21 wells within 10 miles
Operators here
- Braka Operating, L.L.C.18 leases
- Stephens & Johnson Operating Co.2 leases
Related pages
- Braka Operating, L.L.C.Braka runs 18 producing leases here, holding 84.7% of the field's output.
- Stephens & Johnson Operating Co.Runs 2 producing leases here and the field's oldest, from October 1995.
- Stephens CountyStephens County holds 16 producing leases from this field.
- Palo Pinto CountyPalo Pinto County holds 4 producing leases from this field.
- Stuart, Ellen G. "B"Stuart, Ellen G. "B", lease 155952, the oldest producing lease here.
More
- Texas fields, A to ZEvery field with producing leases in Railroad Commission records.
- Check a stub against a leaseMatch the barrels and mcf on your stub to the state record.
Where this page comes from
- Railroad Commission of Texas production, Form P-4, permits, wells, completions, cut-offs
- Texas Comptroller tax approvals
- U.S. Energy Information Administration prices
- NOAA storms and cold
- NOAA open data VIIRS night heat (NOAA-20, NOAA-21, Suomi NPP)
- U.S. Geological Survey photo from the air
- U.S. Census Bureau county shapes