
Texas gas wellRRC 09-239184Last oil or gas reported Oct 2021
Guyer
The lease produced 19,916 thousand cubic feet of gas in its last 12 months on record, through December 2021. No report after December 2021 is on file; the State's newest month is August 2026.
- Last operator
- Eagleridge Operating, LLC
- County
- Denton
- On record since
- October 2007
- Newest report on file
- December 2021
- Unit on the newest permit
- 84 acres
Outline: the original land surveys this lease's wells sit in. The State publishes no lease outlines. RRC surveys, 2026-09-29.
No oil or gas reported in the 12 months through August 2026
Oil or gas was last reported for October 2021
Its whole life in the Railroad Commission's monthly reports, which start in January 1993; it first reported in September 2007. Royalty owners and their heirs can still be on the county roll after the checks stop.
- September 2007First report
- 2008The year it sold the most
- Eagleridge Operating, LLCLast operator, from January 2020
- October 2021Last production
- 55 monthsNo oil or gas reported, November 2021 to May 2026
thousand cubic feet of gas sold since September 2007.
what it all sold for at each month's public prices, 100% of the lease.
SourceRailroad Commission production reports since January 1993 (oil and gas sold); EIA prices, through August 2026.
The story, from 171 monthly reports
On record since October 2007
October 2007: the first month the lease sold gas on record, 18,130 thousand cubic feet.
September 2008: Pioneer Natural Res. USA, Inc. took over.
August 2013: Eagleridge Operating, LLC took over from Pioneer Natural Res. USA, Inc..
December 2021 is the newest monthly production report on file.
SourceRailroad Commission production reports, October 2007 through December 2021. Not a forecast, not reserves.
Checks stopped on this lease?
The one well on this lease is marked plugged.
SourceRailroad Commission production, P-5 and P-4 records, data through August 2026.See why checks stop on this lease
171 months against 7 other recordsNew
Every month since October 2007, and what else happened that month
The lease is the line on top. Under it, on the same clock: the weather, the State, the price, the wells next door, who ran the lease, who bought from it and the rest of the field. Move across it.
Gas averaged $1.74 an mcf · Eagleridge Operating, LLC
- Nothing else on record this month.
Move the pointer or drag across the chart. The numbered buttons jump to each drop.
Monthly gas sold from this lease since October 2007, with seven record tracks beneath it. Use the left and right arrow keys to move month by month.. 171 months from October 2007 to December 2021. The most in one month: 25,453 mcf, December 2007. The newest month: 0 mcf. 9 months with nothing reported. Moments marked: 1, May 2008; 2, Aug 2015; 3, Aug 2018; 4, Sep 2018; 5, Jun 2019; 6, Mar 2020; 7, Apr 2020.
SourcesProduction, cut-offs, operators and buyers: Railroad Commission of Texas. Weather: NOAA. Prices: U.S. Energy Information Administration. Fracs: FracFocus. A record in the same month is not proof of a cause. Through December 2021.
Royalty Watch tells you the month a drop starts, with the records from that month.Watch this lease
224 months, one line eachNew
No production was reported from November 2021 through May 2026
A gap is a month with no oil and no gas reported. Many leases end after 60 to 90 days without production unless the lease says otherwise.
months in a row with nothing reported, from November 2021 through May 2026. Of the 55 months, 2 with a report on file showing no oil and no gas and 53 with no report on file.
thousand cubic feet of gas on the newest report on file with oil or gas, for October 2021. The 2 reports on file after it, the newest for December 2021, show no oil and no gas. No report after December 2021 is on file; the State's newest month is August 2026.
of 224 months with oil or gas reported since October 2007.
A shut-in payment or work on the wells can keep a lease alive through a gap. Your own lease paper decides.
SourceRailroad Commission production reports, October 2007 through May 2026. The newest months, after May 2026, are left out of the count because reports arrive late.
Royalty Watch tells you when a silent month starts, and drafts the letter asking whether the lease is still in force.Watch this lease
15 years of state records, 2007 to 2021
Sold since October 2007
$3.19million
Only filed sales with a published price are included. Some sales figures or prices are unavailable.
- Gas sold
- 673,124thousand cubic feet
| Year | Oil, dollars | Gas, dollars | Total |
|---|---|---|---|
| 2007 | $0 | $303,000 in priced filings | $303,000 in priced filings |
| 2008 | $0 | $1.08 million in priced filings | $1.08 million in priced filings |
| 2009 | $0 | $358,000 | $358,000 |
| 2010 | $0 | $329,000 | $329,000 |
| 2011 | $0 | $269,000 | $269,000 |
| 2012 | $0 | $147,000 | $147,000 |
| 2013 | $0 | $156,000 in priced filings | $156,000 in priced filings |
| 2014 | $0 | $105,000 in priced filings | $105,000 in priced filings |
| 2015 | $0 | $69,100 | $69,100 |
| 2016 | $0 | $62,400 | $62,400 |
| 2017 | $0 | $53,900 | $53,900 |
| 2018 | $0 | $70,100 | $70,100 |
| 2019 | $0 | $65,000 | $65,000 |
| 2020 | $0 | $42,600 | $42,600 |
| 2021 | $0 | $74,900 | $74,900 |
Did a relative own a share of this lease?
SourcesRailroad Commission Production Data Query, every monthly report since October 2007. EIA monthly WTI and Henry Hub prices. Not a forecast, not reserves.
Who has run this lease
The operator changed two times, most recently in August 2013
The company named on each monthly report to the State. The operator is not always the company that pays.
- Eagleridge Operating, LLCAugust 2013 to December 2021
- Pioneer Natural Res. USA, Inc.September 2008 to July 2013
- Operator number 232883October 2007 to August 2008
SourcesRailroad Commission production reports, the operator on each month’s report, October 2007 through December 2021.
The newest well, seen from the side
No well on the way. Well 3 was completed in September 2007.
- Permit filedNot on file
- Drilling startedNot on file
- FrackedNot on file
- Completion filedSeptember 20, 2007
- First production on the leaseNot on file
- First checkNot on file
SourcesRailroad Commission drilling permits and well records, and the FracFocus registry. Lease record built November 18, 2026.
Royalty Watch follows new well permits and completions on this lease.Watch this lease
About 6 miles across
Wells on this lease and around it
For a lawyer, a buyer or a probate file. Wells and permits within about 2 miles. Railroad Commission of Texas, FracFocus and USGS imagery.
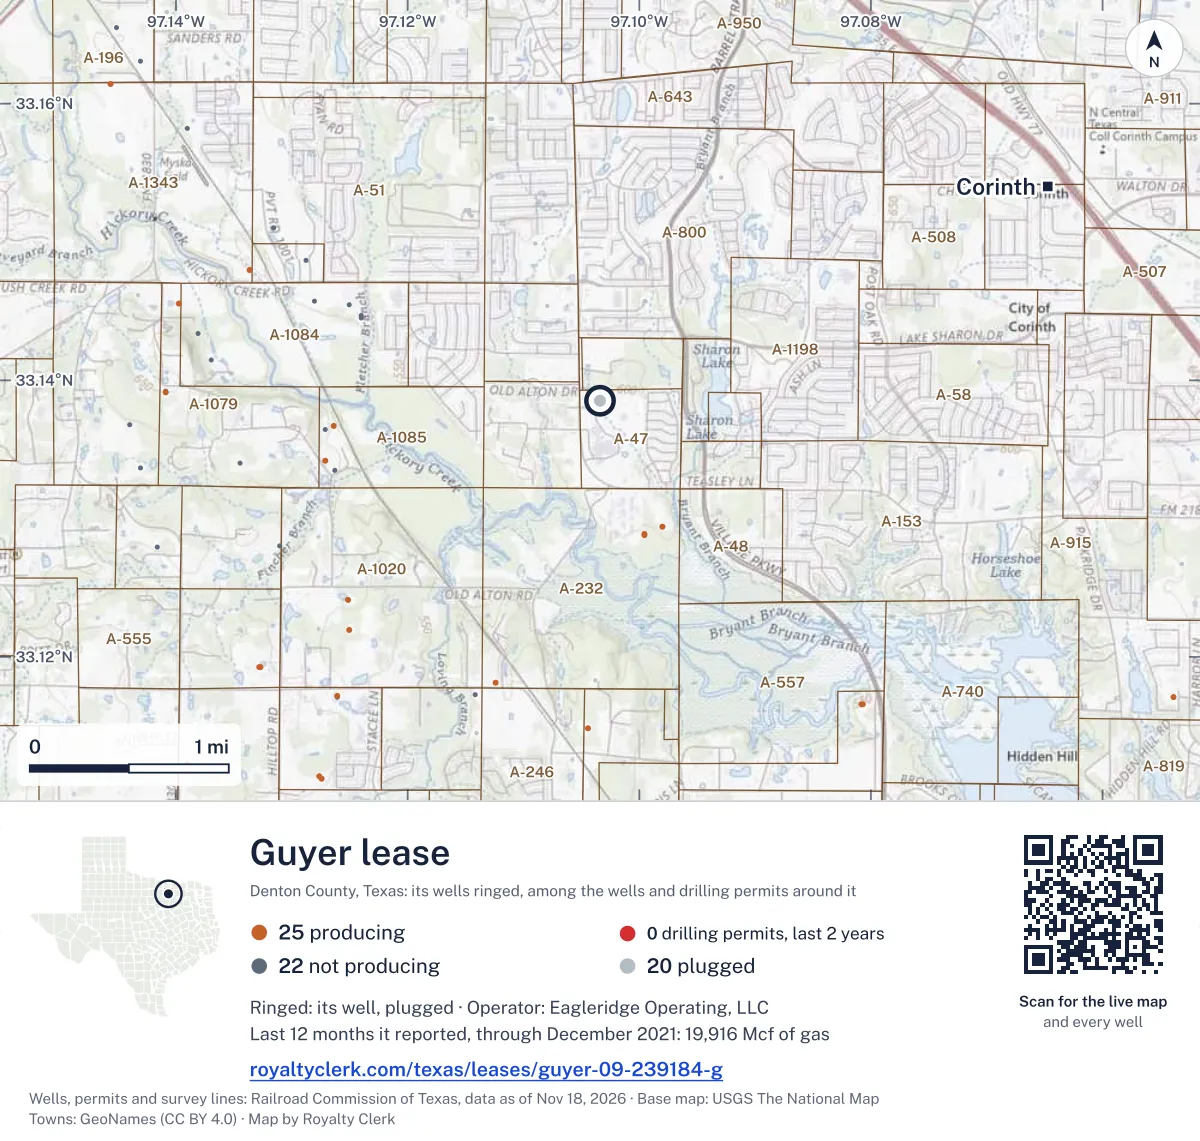
From the State's well records
One well on this lease
| Well | API number | Completed | Sidewaysfeet | Depthfeet | Today |
|---|---|---|---|---|---|
| 3 | 42-121-33149 | September 2007 | 1,405 | 9,213 | Plugged |
SourceRailroad Commission wellbore and completion records.
What the drilling permits say
84acres on the newest permit
- 84 acres, on the 2007 permits
Gas · last sale month, October 2021 New
Four prices for the same gas
Last sale October 2021. Henry Hub $5.51 in October 2021, the last sale month.
Texas Comptroller
Tax approval on record
LOW PRODUCING WELLS, approved October 6, 2015.
HIGH COST GAS REDUCED TAX RATE, approved December 19, 2008.
EIA record dated October 1, 2026Estimate your royalty
Type the decimal from your division order
The starting decimal is an example. Nothing you type here leaves this page.
$24a month
At these prices the whole lease’s reported sales were about $74,900 over 12 reported months. Your estimated share is $292 before taxes and deductions.
Monthly owner volumes and values
| Month | Oil (bbl) | Oil value | Gas (mcf) | Gas value | Total |
|---|---|---|---|---|---|
| December 2021 | 0 | $0.00 | 0 | $0.00 | $0.00 |
| November 2021 | 0 | $0.00 | 0 | $0.00 | $0.00 |
| October 2021 | 0 | $0.00 | 5.8867 | $32.44 | $32.44 |
| September 2021 | 0 | $0.00 | 9.7734 | $50.43 | $50.43 |
| August 2021 | 0 | $0.00 | 7.2656 | $29.57 | $29.57 |
| July 2021 | 0 | $0.00 | 7.3828 | $28.35 | $28.35 |
| June 2021 | 0 | $0.00 | 8.0742 | $26.32 | $26.32 |
| May 2021 | 0 | $0.00 | 6.9492 | $20.22 | $20.22 |
| April 2021 | 0 | $0.00 | 8.3633 | $22.25 | $22.25 |
| March 2021 | 0 | $0.00 | 8.8164 | $23.10 | $23.10 |
| February 2021 | 0 | $0.00 | 6.957 | $37.22 | $37.22 |
| January 2021 | 0 | $0.00 | 8.3281 | $22.57 | $22.57 |
SourcesRailroad Commission monthly production, EIA Henry Hub, SEC filings and Texas Comptroller records.
Watch Plus sets public prices beside the price on your statement.See Watch Plus
Who takes the oil and gasNew
No buyer shares an owner with the operator
The State lists who gathers and who buys from each lease. Company filings list who owns whom. Here they are on one drawing.
No shared owner, officer or address on record between the gas buyers and the operator.
Who buys my oilOil price check
SourcesBuyers and gatherers: Railroad Commission Form P-4 records, as of October 24, 2026. Ownership: U.S. Securities and Exchange Commission filings.
Royalty Watch tells you the day the buyer of your oil or gas changes.Watch this lease
Seen from space
Heat at the pad, beside reported gas use
Satellite match
Not matched
The lease’s newest month on record, December 2021, is before the satellites’ record begins in February 2024.
nights of heat
months with reported flaring (disposition records unavailable)
months with heat and none reported
SourcesNOAA VIIRS night readings and Railroad Commission gas disposition reports. Satellite record through November 17, 2026.
Watch Plus checks statement months beside the satellite record.See Watch Plus
Where the gas went, month by month
All of the gas went to a transmission line in the last 12 months
Where gas goes decides how it is paid: processed gas can carry plant products and processing fees, gas sold straight to a pipeline usually does not.
SourcesRailroad Commission production reports, gas disposition by code, January 2020 to October 2021.
The county appraisal roll
No public roll figures
County mineral roll
No public roll figures
There are no publishable figures for this lease from the 2026 county mineral roll.
Royalty Clerk has mineral rolls for 146 Texas counties.
Source County appraisal district mineral rolls.
From the state record
Ask a question about Guyer
The available public records have no additional lease-specific answers as of November 19, 2026.
Every monthly report the State holds
171 months, newest first
| Month | Gas soldthousand cubic feet | Flared or ventedthousand cubic feet | Sold forat public prices | Operator |
|---|---|---|---|---|
| DecemberDec 2021 | No oil or gas reported | Eagleridge Operating, LLC | ||
| NovemberNov 2021 | No oil or gas reported | Eagleridge Operating, LLC | ||
| OctoberOct 2021 | 1,507 | 0 | $8,300 | Eagleridge Operating, LLC |
| SeptemberSep 2021 | 2,502 | 0 | $12,900 | Eagleridge Operating, LLC |
| AugustAug 2021 | 1,860 | 0 | $7,570 | Eagleridge Operating, LLC |
| JulyJul 2021 | 1,890 | 0 | $7,260 | Eagleridge Operating, LLC |
| JuneJun 2021 | 2,067 | 0 | $6,740 | Eagleridge Operating, LLC |
| MayMay 2021 | 1,779 | 0 | $5,180 | Eagleridge Operating, LLC |
| AprilApr 2021 | 2,141 | 0 | $5,700 | Eagleridge Operating, LLC |
| MarchMar 2021 | 2,257 | 0 | $5,910 | Eagleridge Operating, LLC |
| FebruaryFeb 2021 | 1,781 | 0 | $9,530 | Eagleridge Operating, LLC |
| JanuaryJan 2021 | 2,132 | 0 | $5,780 | Eagleridge Operating, LLC |
| DecemberDec 2020 | 2,374 | 0 | $6,120 | Eagleridge Operating, LLC |
| NovemberNov 2020 | 2,559 | 0 | $6,680 | Eagleridge Operating, LLC |
| OctoberOct 2020 | 1,888 | 0 | $4,510 | Eagleridge Operating, LLC |
| SeptemberSep 2020 | 1,854 | 0 | $3,560 | Eagleridge Operating, LLC |
| AugustAug 2020 | 1,709 | 0 | $3,930 | Eagleridge Operating, LLC |
| JulyJul 2020 | 1,628 | 0 | $2,870 | Eagleridge Operating, LLC |
SourcesTexas Railroad Commission Production Data Query, through December 2021. Prices: EIA.
Likely owed Jan 2025
A whole month was never paid
The state shows 28,175 bbl of oil sold from this lease in January 2025, so your share is 27.51 bbl. No statement covers January 2025. That is the month the operator changed from Endeavor Energy Resources to Diamondback.
Ask Diamondback owner relations: is January 2025 being held in suspense after the change of operator?
$2,277oil + gas
A sample finding, from our example check. The full example found $3,328 likely owed.
Around this lease
Nearby
Eagleridge Operating, LLC in Denton County
- Nobles21,199 mcf last 12 months
- Munson19,657 mcf last 12 months
- Vaughn20,868 mcf last 12 months
- Munson18,932 mcf last 12 months
- Mayday-Lattimore Gas Unit20,483 mcf last 12 months
- Alliance Airport KS Unit20,432 mcf last 12 months
- Alliance Tech Center20,255 mcf last 12 months
- Sycamore Bend Unit19,264 mcf last 12 months
- Jones16,727 mcf last 12 months
- Point Vista Unit18,535 mcf last 12 months
Newark, East (Barnett Shale) field
- Weatherby Unit19,943 mcf last 12 months
- Everman Unit19,941 mcf last 12 months
- Harris Langford Unit19,016 mcf last 12 months
- Caddell Unit16,400 mcf last 12 months
- Torres19,916 mcf last 12 months
- Thelma Jean Turner19,914 mcf last 12 months
- Massey19,887 mcf last 12 months
- Uta "A" Unit19,910 mcf last 12 months
- USA Trust18,412 mcf last 12 months
- Graham Heirs19,901 mcf last 12 months
Leases within 10 km
- Guyer10,534 mcf last 12 months · 0.1 km
- Guyer, J. H.9,518 mcf last 12 months · 0.1 km
- Meredith9,031 mcf last 12 months · 0.9 km
- Forester9,637 mcf last 12 months · 0.9 km
- Martin64,237 mcf last 12 months · 1.1 km
- BLM Denton200,334 mcf last 12 months · 1.1 km
- BLM Denton198,711 mcf last 12 months · 1.1 km
- BLM Denton223,430 mcf last 12 months · 1.1 km
- Connell Unit5,015 mcf last 12 months · 1.4 km
- Acme Unit19,756 mcf last 12 months · 1.8 km
Drilling permits within 10 km
- CHARALAMBOPOULOS 1 (AW) #1Hrecompletion · horizontal · BKV Barnett, LLC · Nov 17, 2026 · 9.1 km
Same name in district 09
- Guyer10,534 mcf last 12 months
Where it sits
This county
Where this page comes from
- Railroad Commission of Texas production, Form P-4, permits, wells
- Texas Comptroller tax approvals, lease values
- U.S. Energy Information Administration prices
- FracFocus frac dates
- NOAA storms and cold
- U.S. Geological Survey photos