
Texas oil lease
ProducingMOORE
Moore is an oil lease in Yoakum County, Texas, operated by Burk Royalty Co., Ltd. in the Brahaney field.
3 wells
- Operator
- Burk Royalty Co., Ltd.
- County
- Yoakum County
- Field
- Brahaney
- RRC lease
- 8A-60201
8 royalty accounts on the county roll
Is your family on this lease?
Where it sits
This county
- Oil in Aug 2026
- 137 bbl
- Reporting since
- Jan 2020
Did a relative own a share of this lease?
Pick the year they passed and see what the lease has sold since.
Wells on this lease and around it
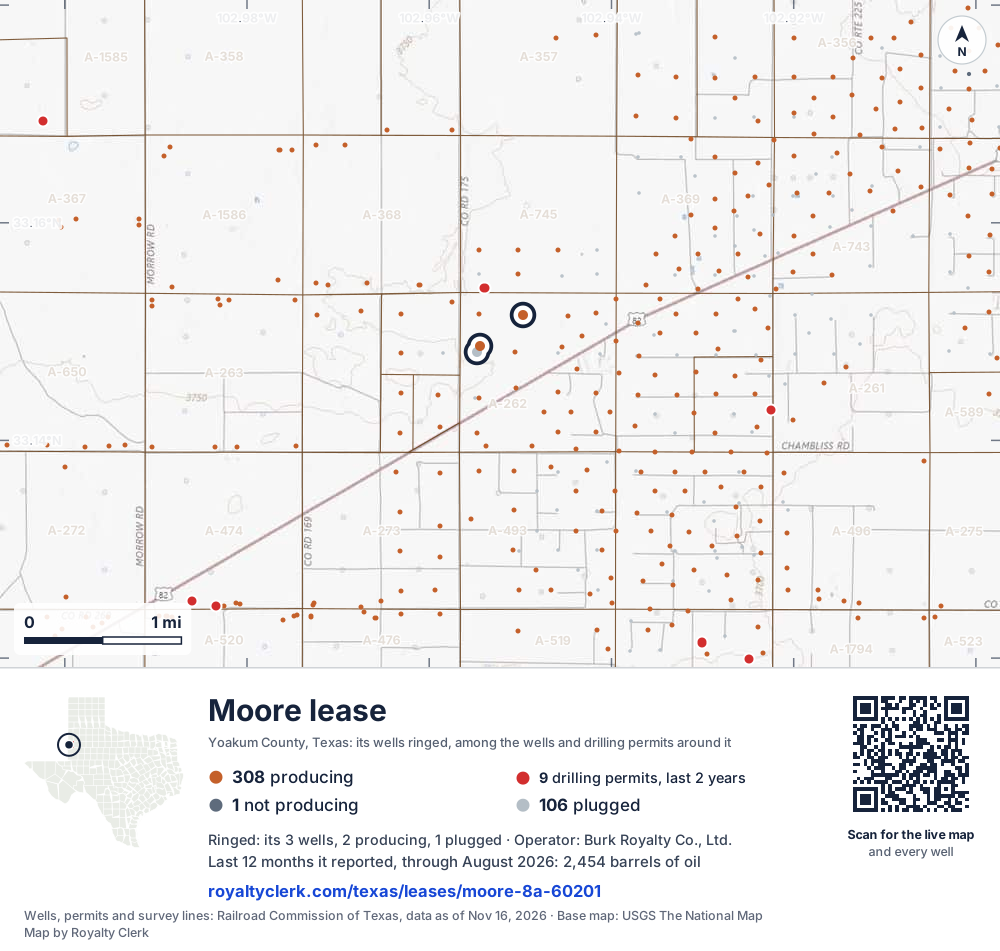
- This lease3Its wells, ringed on the map: 2 producing, 1 plugged
- Drilling locations9Permits issued in the last two years
- Producing wells308On a lease reporting production now
- Not producing1Shut in, inactive or no lease on record
- Plugged106The state's wellbore record says plugged
The 3 ringed dots are this lease's wells, each where the Railroad Commission's map puts it. The other dots are wells and drilling permits of the last 24 months on the land around it; the counts are for everything in the picture, which is about 6 miles across. The thin brown lines are the original land surveys; where there is room, a survey carries its abstract number, the number deeds and division orders cite. Sources: Railroad Commission of Texas well layers, drilling permit files and survey lines, base map from USGS The National Map.
A one-page map of this lease to print, for a lawyer, a buyer or a probate file.
Use this map on your site
You may show this map on any site, unchanged. Keep the credit line and its link to Royalty Clerk under the map. The picture updates by itself as the state records new wells and permits.
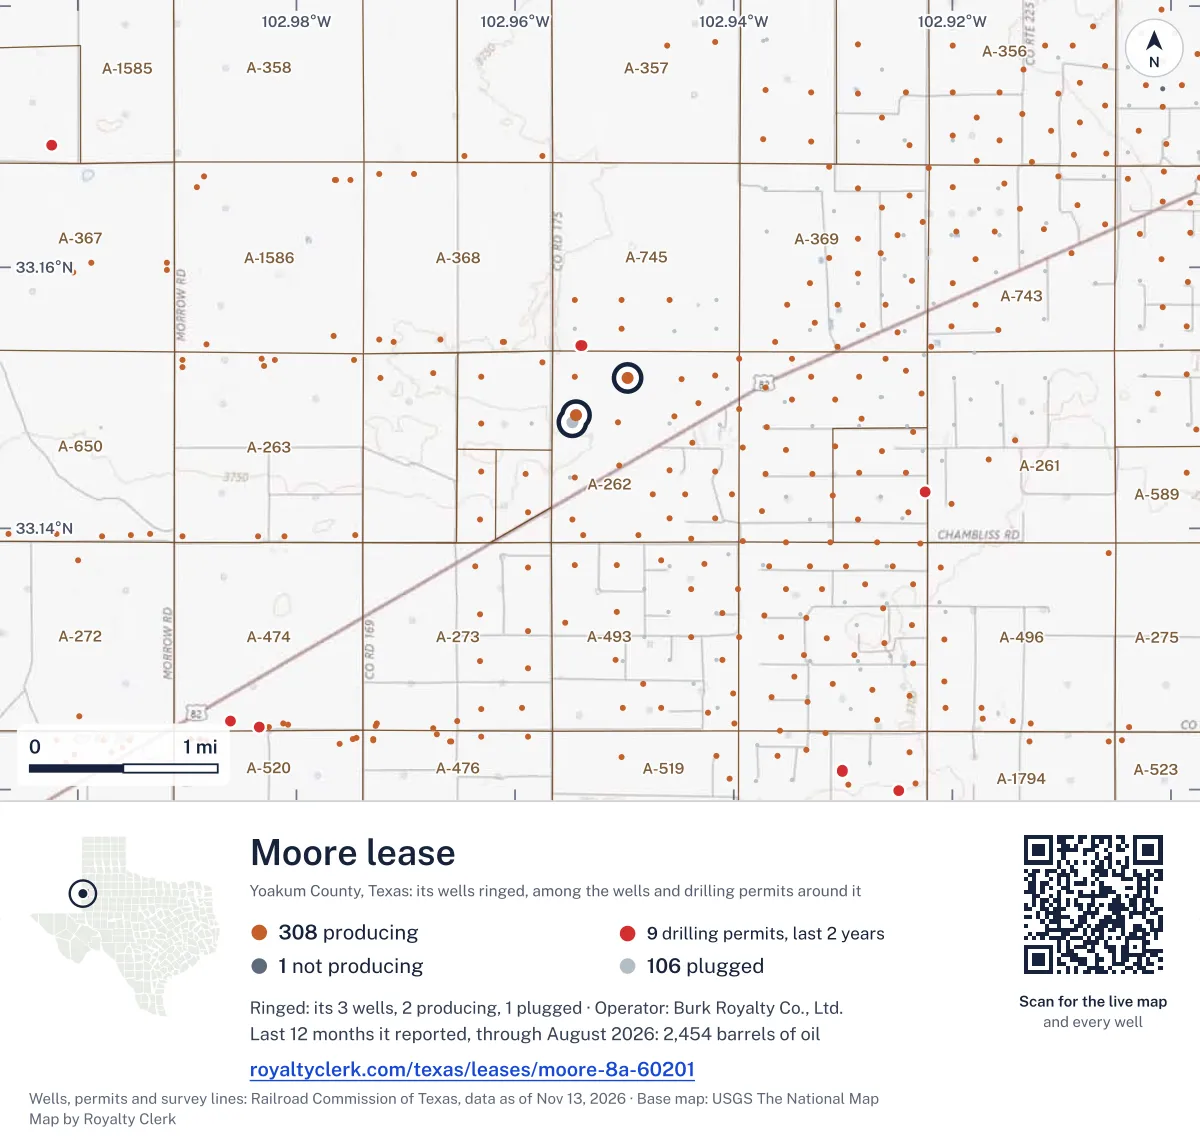
<a href="https://royaltyclerk.com/texas/leases/moore-8a-60201"><img src="https://royaltyclerk.com/maps/lease-wells/moore-8a-60201.svg" alt="Map of the Moore lease in Yoakum County, Texas: its 3 wells ringed, among 415 wells and 9 recent drilling locations in a picture about 6 miles across." width="1000" height="951" loading="lazy" style="max-width:100%;height:auto;border:0"></a>
<p style="margin:4px 0 0;font-size:14px">Map: <a href="https://royaltyclerk.com/texas/leases/moore-8a-60201">Wells on the Moore lease, Yoakum County, Texas</a> by Royalty Clerk, from Railroad Commission of Texas records</p>
Other leases named Moore
- 8A-60201, oil leaseThis leaseProducing2,454 bbllast 12 reported months
- 8A-00365, oil leaseNo report in 6+ months3 bbllast 12 reported monthsRun by 27:17 Enterprises, LLC
Other Moore leases in Yoakum County
Production by month
Oil output fell 19% over the last 12 months
- Oil (bars)
- Gas (line)
- Last 12 months
SourceTexas Railroad Commission Production Data Query, through Aug 2026.
From the state record
What owners ask about Moore
- When is the check for August 2026 due?
- August 2026 is the newest month the state has posted for this lease. Texas law gives the payor until 60 days after the end of the sale month for oil and 90 for gas: the oil by Oct 30, 2026, unless the lease sets another time.
- Source: Railroad Commission production reports; Texas Natural Resources Code §91.402.
- See your next three checks
- Which Texas production tax rate applies?
- The Texas Comptroller lists no approved exemption or reduced rate for this lease for August 2026, so the full 4.6% on oil applies.
- Source: Texas Comptroller, approved severance tax exemptions.
- Check the tax on your stub
- Who buys the oil and gas?
- Oil: Rio Energy International, Inc. gathers it. Gas from oil wells: Stakeholder Gas Services, LLC buys it; Stakeholder Gas Utility, LLC gathers it. The buyer's price is what a royalty check is figured on.
- Source: Railroad Commission Form P-4, gatherers and purchasers.
- See every buyer and past buyers
- How many 1099s should an owner expect for 2025?
- One company, Burk Royalty Co., Ltd., filed this lease's reports behind every 2025 check, so most owners get one form. The operator is not always the company that pays, so go by the name on the stubs.
- Source: Railroad Commission production reports, operator of record by month.
- Check your 1099 against it
Free tools, already on this lease
Ask a question about Moore
33 years of state records, 1993–2026
MOORE since 1993
We read every monthly report the Railroad Commission holds, back to January 1993, and this lease was already producing then. It filed 404 monthly reports through August 2026.
Sold since 1993
$4.4 million
What the whole lease’s oil and gas sold for at each month’s public prices, before tax and the operator’s deductions. A royalty owner’s share is their decimal of it.
- Oil sold
- 67,283 bbl
- Gas sold
- 133,198 mcf
- Best year
- 2013$593,000 sold
- Last report
- Aug 2026First: Jan 1993
Its best year was 2013: $593,000 of oil and gas sold
Each bar is what the lease’s oil and gas sold for that year, at that month’s prices. 2026 is only part of a year in the records, drawn lighter.
- Oil
- Gas
SourceTexas Railroad Commission Production Data Query, every monthly report since January 1993; EIA monthly WTI and Henry Hub prices (before 1997, EIA's yearly Texas natural gas wellhead price), through August 2026.
Every year as a table
| Year | Months | Oil sold, bbl | Gas sold, mcf | Sold for |
|---|---|---|---|---|
| 2026 * | 8 | 1,532 | 0 | $127,669 |
| 2025 | 12 | 3,027 | 0 | $198,244 |
| 2024 | 12 | 2,747 | 9,640 | $226,483 |
| 2023 | 12 | 3,315 | 9,114 | $277,017 |
| 2022 | 12 | 5,361 | 11,997 | $593,276 |
| 2021 | 12 | 3,673 | 4,433 | $268,235 |
| 2020 | 12 | 3,124 | 5,482 | $136,777 |
| 2019 | 12 | 2,773 | 5,306 | $172,184 |
| 2018 | 12 | 2,533 | 5,861 | $181,608 |
| 2017 | 12 | 2,812 | 5,133 | $158,385 |
| 2016 | 12 | 2,876 | 2,927 | $131,145 |
| 2015 | 12 | 3,119 | 6,001 | $167,802 |
| 2014 | 12 | 3,040 | 6,097 | $311,395 |
| 2013 | 12 | 5,754 | 8,467 | $593,773 |
| 2012 | 12 | 780 | 2,085 | $78,514 |
| 2011 | 12 | 899 | 1,270 | $89,345 |
| 2010 | 12 | 226 | 888 | $22,020 |
| 2009 | 12 | 216 | 512 | $15,088 |
| 2008 | 12 | 226 | 361 | $25,683 |
| 2007 | 12 | 419 | 630 | $32,702 |
| 2006 | 12 | 750 | 895 | $54,765 |
| 2005 | 12 | 740 | 3,090 | $63,583 |
| 2004 | 12 | 960 | 5,709 | $73,934 |
| 2003 | 12 | 907 | 6,013 | $60,759 |
| 2002 | 12 | 1,020 | 5,665 | $45,239 |
| 2001 | 12 | 1,709 | 6,052 | $71,339 |
| 2000 | 12 | 2,729 | 7,650 | $114,823 |
| 1999 | 12 | 2,831 | 7,365 | $70,759 |
| 1998 | 12 | 3,631 | 4,534 | $62,398 |
| 1997 | 12 | 2,910 | 0 | $59,213 |
| 1996 | 12 | 169 | 0 | $4,007 |
| 1995 | 12 | 159 | 0 | $2,868 |
| 1994 | 12 | 316 | 9 | $5,582 |
| 1993 | 12 | 0 | 12 | $25 |
* Part of the year: the records run through August 2026.
Where the gas went
All of the gas went to a transmission line in the 8 months reported
SourceTexas Railroad Commission Production Data Query, through Aug 2026.
Who has run this lease
The operator changed once, most recently in Oct 2021
- Burk Royalty Co., Ltd. Oct 2021 to now
- Walsh Petroleum, Inc. Jan 2020 to Sep 2021
SourceTexas Railroad Commission Production Data Query, through Aug 2026.
3 wells on this lease
| API number | Well | Status | Completed |
|---|---|---|---|
| 42-501-20047 | Moore 1 | Shut in | Feb 9, 1967 |
| 42-501-20060 | Moore 2 | Plugged | May 15, 1967 |
| 42-501-35947 | Moore 2X | Shut in | Dec 12, 2012 |
1 of the 3 wells is marked plugged in the Railroad Commission's wellbore records. 2 are not plugged. A plugged well is closed for good. A well that is not plugged can be put back on production, and its operator still owes the plugging.
SourceTexas Railroad Commission production records and full wellbore file.
Buyers and gatherers
| Company | Product | Role | Share% | From | Until |
|---|---|---|---|---|---|
| Rio Energy International, Inc. | Oil | Gathers | 100 | Jun 1, 2023 | – |
| Stakeholder Gas Services, LLC | Casinghead gas | Buys | 100 | Jan 1, 2020 | – |
| Stakeholder Gas Utility, LLC | Casinghead gas | Gathers | 100 | Jan 1, 2020 | – |
| Sentinel Transportation, LLC | Oil | Gathers | 100 | Sep 1, 2005 | Jun 1, 2023 |
| Markwest Pinnacle, L.l.c. | Casinghead gas | Gathers | 100 | Mar 1, 2009 | Jan 1, 2020 |
| Markwest Pinnacle, L.l.c. | Casinghead gas | Buys | 100 | Mar 1, 2009 | Jan 1, 2020 |
SourceRailroad Commission Form P-4 file, Oct 24, 2026 (source).
80 acres on the newest permit
- Worth asking
A Rule 37 case is listed
The RRC permit records list a Rule 37 case. This does not establish your royalty share. Ask for the permit and unit plat for your well.
| API number | Well no. | Permit issued | Completed | Acreson the permit |
|---|---|---|---|---|
| 42-501-35947 | 2X | May 7, 2012 | Dec 12, 2012 | 80 |
| 42-501-20047 | 1 | – | Feb 9, 1967 | – |
| 42-501-20060 | 2 | – | May 15, 1967 | – |
On the Yoakum County roll
Yoakum County Appraisal District
2026 roll- Owners
- 9
- Accounts
- 9
- Appraised in all
- $209k$209,085
Each square is one account
- Royalty8
- Working interest1
SourceYoakum County Appraisal District, 2026 mineral roll (source), read Oct 7, 2026. Accounts matched to this lease by RRC number or lease name; no owner is named.
Estimate your royalty
36 months, newest first
| Month | Oil producedbbl | Oil soldbbl | Gas producedmcf | Gas soldmcf, codes 2+3 | Flaredmcf | WTI$/bbl | Henry Hub$/MMBtu |
|---|---|---|---|---|---|---|---|
| Aug 2026Burk Royalty | 137 | 165 | 0 | 0 | 0 | $83.90 | $2.78 |
| Jul 2026Burk Royalty | 154 | 192 | 0 | 0 | 0 | $80.46 | $2.89 |
| Jun 2026Burk Royalty | 199 | 192 | 0 | 0 | 0 | $84.81 | $3.15 |
| May 2026Burk Royalty | 197 | 199 | 0 | 0 | 0 | $102.13 | $2.94 |
| Apr 2026Burk Royalty | 193 | 194 | 0 | 0 | 0 | $100.32 | $2.77 |
| Mar 2026Burk Royalty | 203 | 191 | 0 | 0 | 0 | $91.38 | $3.04 |
| Feb 2026Burk Royalty | 194 | 201 | 0 | 0 | 0 | $64.51 | $3.62 |
| Jan 2026Burk Royalty | 225 | 198 | 0 | 0 | 0 | $60.04 | $7.72 |
| Dec 2025Burk Royalty | 238 | 294 | 0 | 0 | 0 | $57.97 | $4.26 |
| Nov 2025Burk Royalty | 228 | 253 | 0 | 0 | 0 | $60.06 | $3.79 |
| Oct 2025Burk Royalty | 243 | 214 | 0 | 0 | 0 | $60.89 | $3.19 |
| Sep 2025Burk Royalty | 243 | 214 | 0 | 0 | 0 | $63.96 | $2.97 |
| Aug 2025Burk Royalty | 239 | 214 | 0 | 0 | 0 | $64.86 | $2.91 |
| Jul 2025Burk Royalty | 239 | 314 | 0 | 0 | 0 | $68.39 | $3.20 |
| Jun 2025Burk Royalty | 241 | 208 | 0 | 0 | 0 | $68.17 | $3.02 |
| May 2025Burk Royalty | 240 | 237 | 0 | 0 | 0 | $62.17 | $3.12 |
| Apr 2025Burk Royalty | 261 | 247 | 0 | 0 | 0 | $63.54 | $3.42 |
| Mar 2025Burk Royalty | 323 | 354 | 0 | 0 | 0 | $68.24 | $4.12 |
| Feb 2025Burk Royalty | 249 | 246 | 0 | 0 | 0 | $71.53 | $4.19 |
| Jan 2025Burk Royalty | 293 | 232 | 0 | 0 | 0 | $75.74 | $4.13 |
| Dec 2024Burk Royalty | 214 | 244 | 0 | 0 | 0 | $70.12 | $3.01 |
| Nov 2024Burk Royalty | 262 | 231 | 0 | 0 | 0 | $69.95 | $2.12 |
| Oct 2024Burk Royalty | 191 | 186 | 0 | 0 | 0 | $71.99 | $2.20 |
| Sep 2024Burk Royalty | 264 | 392 | 0 | 0 | 0 | $70.24 | $2.28 |
| Aug 2024Burk Royalty | 279 | 222 | 0 | 0 | 0 | $76.68 | $1.99 |
| Jul 2024Burk Royalty | 280 | 218 | 0 | 0 | 0 | $81.80 | $2.07 |
| Jun 2024Burk Royalty | 260 | 338 | 0 | 0 | 0 | $79.77 | $2.54 |
| May 2024Burk Royalty | 309 | 184 | 0 | 0 | 0 | $80.02 | $2.12 |
| Apr 2024Burk Royalty | 131 | 187 | 1,517 | 1,517 | 0 | $85.35 | $1.60 |
| Mar 2024Burk Royalty | 185 | 267 | 3,734 | 3,734 | 0 | $81.28 | $1.49 |
| Feb 2024Burk Royalty | 193 | 95 | 3,266 | 3,266 | 0 | $77.25 | $1.72 |
| Jan 2024Burk Royalty | 183 | 183 | 1,123 | 1,123 | 0 | $74.15 | $3.18 |
| Dec 2023Burk Royalty | 159 | 143 | 951 | 951 | 0 | $71.90 | $2.52 |
| Nov 2023Burk Royalty | 73 | 69 | 3 | 3 | 0 | $77.69 | $2.71 |
| Oct 2023Burk Royalty | 98 | 189 | 763 | 763 | 0 | $85.64 | $2.98 |
| Sep 2023Burk Royalty | 136 | 96 | 1,122 | 1,122 | 0 | $89.43 | $2.64 |
SourceTexas Railroad Commission Production Data Query, through Aug 2026. Prices: EIA, through Oct 2026. Updated Oct 30, 2026.
How to check your stub against this lease Checks stopped on this lease? See the likely reasonsNearby
This lease belongs to
Burk Royalty Co., Ltd. in Yoakum County
- STOPPED SHORT 396-365 'B' UNIT
2,896 bbl
- COY LOWE
3,127 bbl
- PEARL
2,657 bbl
- GIDDYUP 611
2,653 bbl
- BP 540
2,635 bbl
- BRAHANEY COOP "E"
2,183 bbl
- HAMILTON "B"
1,741 bbl
- SANTA FE
1,777 bbl
- PHARR
1,690 bbl
- DUNIGAN "445"
1,584 bbl
Brahaney field
- WEBB ESTATE 423
3,071 bbl
- SHERMAN 368
2,807 bbl
- BP 540
2,635 bbl
- BRAHANEY COOP "E"
2,183 bbl
- CLAWATER UNIT
1,936 bbl
- SHOOK
1,883 bbl
- HAMILTON "B"
1,741 bbl
- SAM "449"
1,800 bbl
- BANKHEAD 335
1,633 bbl
- LUNA 336
1,566 bbl
Leases within 10 km
- WEST BRAHANEY UNIT
91,749 bbl · 0.3 km
- MOORE -A-
428 bbl · 0.3 km
- CHAPPLE, H.
1,229 bbl · 0.5 km
- DIANNE CHAPIN 471
83,738 bbl · 0.6 km
- BOYD "B"
607 bbl · 0.6 km
- DICKINSON
6,731 bbl · 0.8 km
- BOYD
5,861 bbl · 0.9 km
- WEAVER UNIT
24,666 bbl · 0.9 km
- C.D.U. 'A'
27,303 bbl · 0.9 km
- C.D.U.
22,528 bbl · 0.9 km
Drilling permits within 10 km
BRUCE GENTRY JR 598-647 D #13XH
new drill · horizontal · Ring Energy, Inc. · Yoakum County · 9.9 km
Permit 0919527 · Oct 30, 2026
BRUCE GENTRY JR 598-647 CC #12XH
new drill · horizontal · Ring Energy, Inc. · Yoakum County · 9.7 km
Permit 0919491 · Oct 27, 2026
JEREMIAH JOHNSON 667-706 #3XH
new drill · horizontal · Riley Permian Operating Co, LLC · Yoakum County · 7.9 km
Permit 0919319 · Oct 20, 2026
CASSIDY 575 #1W
new drill · Riley Permian Operating Co, LLC · Yoakum County · 8.1 km
Permit 0919062 · Oct 8, 2026
BEATEN PATH 597-648 #35XH
new drill · horizontal · Riley Permian Operating Co, LLC · Yoakum County · 9.4 km
Permit 0918832 · Sep 28, 2026