
RRC operator 427431
J & A Operating
J & A Operating reported 368 barrels of oil and 5,374 mcf of gas in the last 12 months.
Operator dossier
- Producing leases
- 4
- Counties
- 2
- Biggest county
- Wise County
- Biggest field
- Chico, West (Conglomerate 5700)
Get checks from J & A Operating?
A family member owned minerals here?
Search their name: a family member who owned minerals hereWhere they work
fewermore
- Gas, last 12 months
- 5,374 mcf
- Fields
- 4
- Data through
- Jul 2026
- Leases on record
- 4
Where J & A Operating has wells
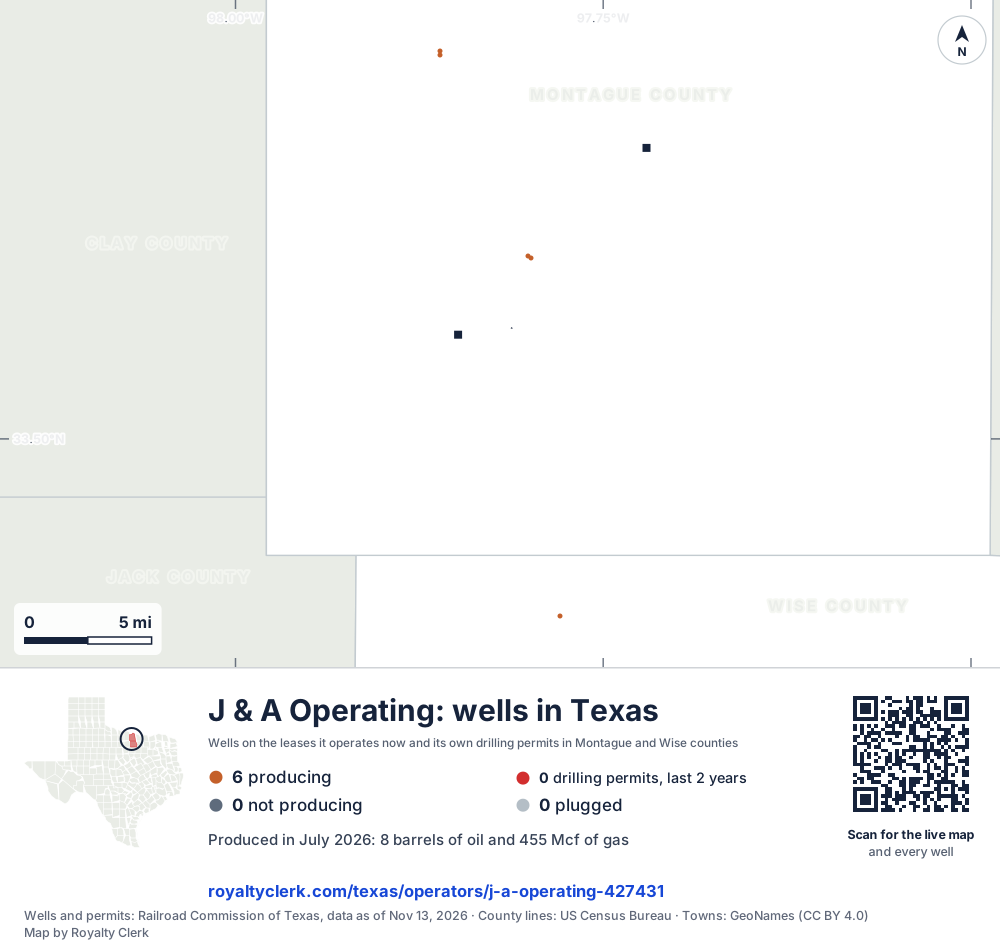
- Drilling locations0Permits issued in the last two years
- Producing wells6On a lease reporting production now
- Not producing0Shut in, inactive or no lease on record
- Plugged0The state's wellbore record says plugged
Each dot is a well on a lease J & A Operating operates now, where the Railroad Commission's map puts it, or one of its drilling permits of the last 24 months. Wells of other operators are not on this map. The picture is about 39 miles across. The white counties are the ones with a well or drilling permit of its own on the map. One more well has no location on the state's map. Sources: Railroad Commission of Texas well layers and drilling permit files, US Census Bureau county outlines, town points from GeoNames (CC BY 4.0).
Use this map on your site
You may show this map on any site, unchanged. Keep the credit line and its link to Royalty Clerk under the map. The picture updates by itself as the state records new wells and permits.
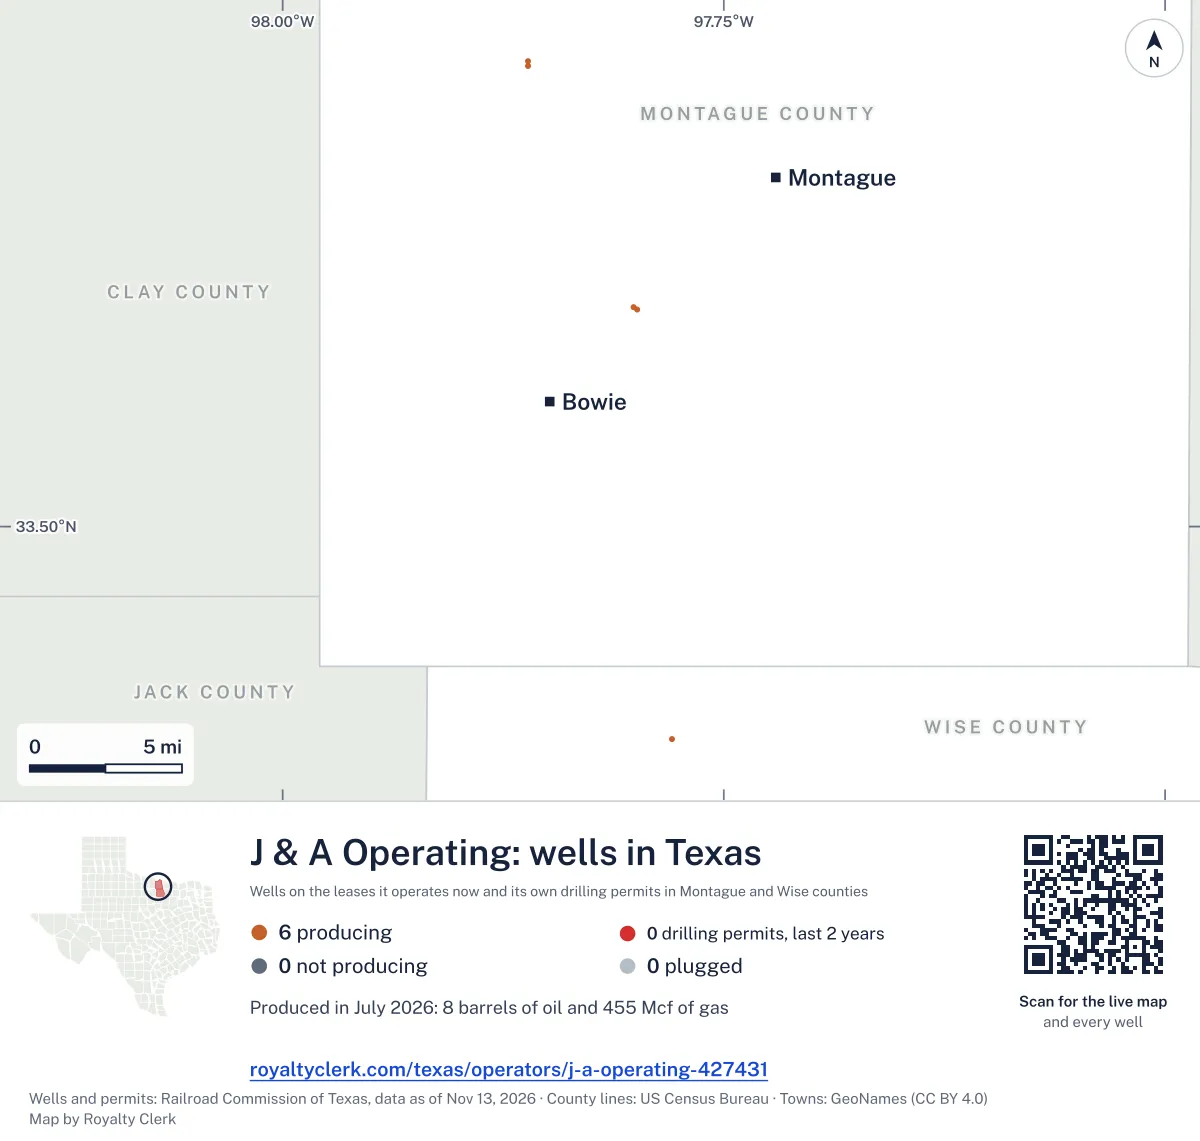
<a href="https://royaltyclerk.com/texas/operators/j-a-operating-427431"><img src="https://royaltyclerk.com/maps/operator-wells/j-a-operating-427431.svg" alt="Map of the wells of J & A Operating in Texas: 6 wells and 0 recent drilling locations, in a picture about 39 miles across." width="1000" height="951" loading="lazy" style="max-width:100%;height:auto;border:0"></a>
<p style="margin:4px 0 0;font-size:14px">Map: <a href="https://royaltyclerk.com/texas/operators/j-a-operating-427431">Oil and gas wells of J & A Operating in Texas</a> by Royalty Clerk, from Railroad Commission of Texas records</p>Five years of J & A Operating output
Oil output from J & A Operating fell 58% over the last 12 months
368 bbl through Jul 2026, against 878 bbl a year earlier. Peak Jul 2022: 270 bbl.
Gas output from J & A Operating rose 4% over the last 12 months
5,374 mcf through Jul 2026, against 5,164 mcf a year earlier. Peak Dec 2022: 842 mcf.
SourceTexas Railroad Commission Production Data Query, operator 427431, through Jul 2026, file dated Oct 20, 2026.
J & A Operating leases, biggest first
Under each volume: change on the year before.
241bbl oil−59%
46bbl oil−44%
43bbl oil−77%
38bbl oil+36%
Showing 4 of 4.
SourceTexas Railroad Commission Production Data Query.
Counties and fields where J & A Operating produces
Counties, by J & A Operating oil
Wise County leads
Fields, by J & A Operating oil
Sancree (Strawn) leads
Recent drilling permits for J & A Operating
No recent permits.
Where the gas of J & A Operating went
- Plants
- 0.0%
- Pipelines
- 100%
- Lease fuel
- 0.0%
- Flared or vented
- 0.0%
SourceTexas Railroad Commission Production Data Query, last 12 months. What the codes mean