
RRC operator 836026
Tare Resources, LLC
Tare Resources, LLC reported 3,209 barrels of oil and 15,546 mcf of gas in the last 12 months.
Operator dossier
- Producing leases
- 27of 37 on record
- Counties
- 5
- Biggest county
- Live Oak County
- Biggest field
- Bolland Ranch (Hockley)
Get checks from Tare Resources, LLC?
A family member owned minerals here?
Search their name: a family member who owned minerals hereWhere they work
fewermore
- Gas, last 12 months
- 15,546 mcf
- Fields
- 8
- Data through
- Jul 2026
- Leases on record
- 37
Where Tare Resources, LLC has wells
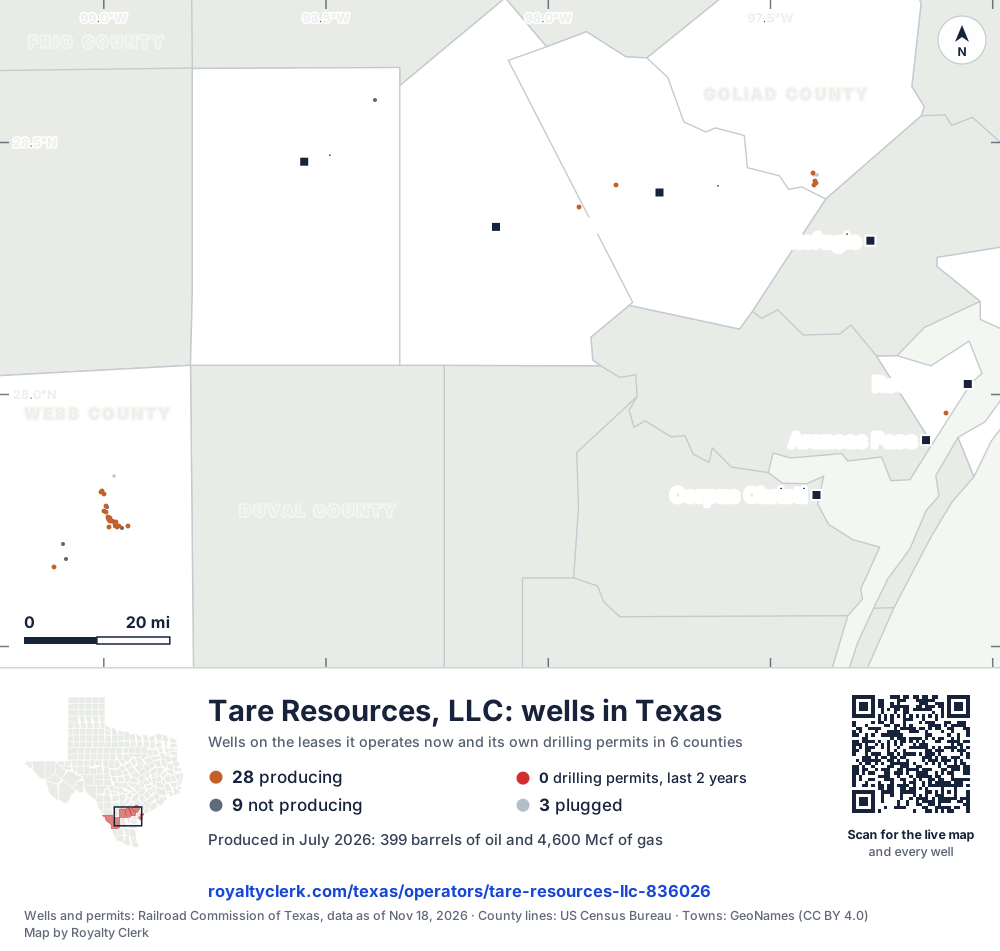
- Drilling locations0Permits issued in the last two years
- Producing wells28On a lease reporting production now
- Not producing9Shut in, inactive or no lease on record
- Plugged3The state's wellbore record says plugged
Each dot is a well on a lease Tare Resources, LLC operates now, where the Railroad Commission's map puts it, or one of its drilling permits of the last 24 months. Wells of other operators are not on this map. The picture is about 137 miles across. The white counties are the ones with a well or drilling permit of its own on the map. Sources: Railroad Commission of Texas well layers and drilling permit files, US Census Bureau county outlines, town points from GeoNames (CC BY 4.0).
Use this map on your site
You may show this map on any site, unchanged. Keep the credit line and its link to Royalty Clerk under the map. The picture updates by itself as the state records new wells and permits.
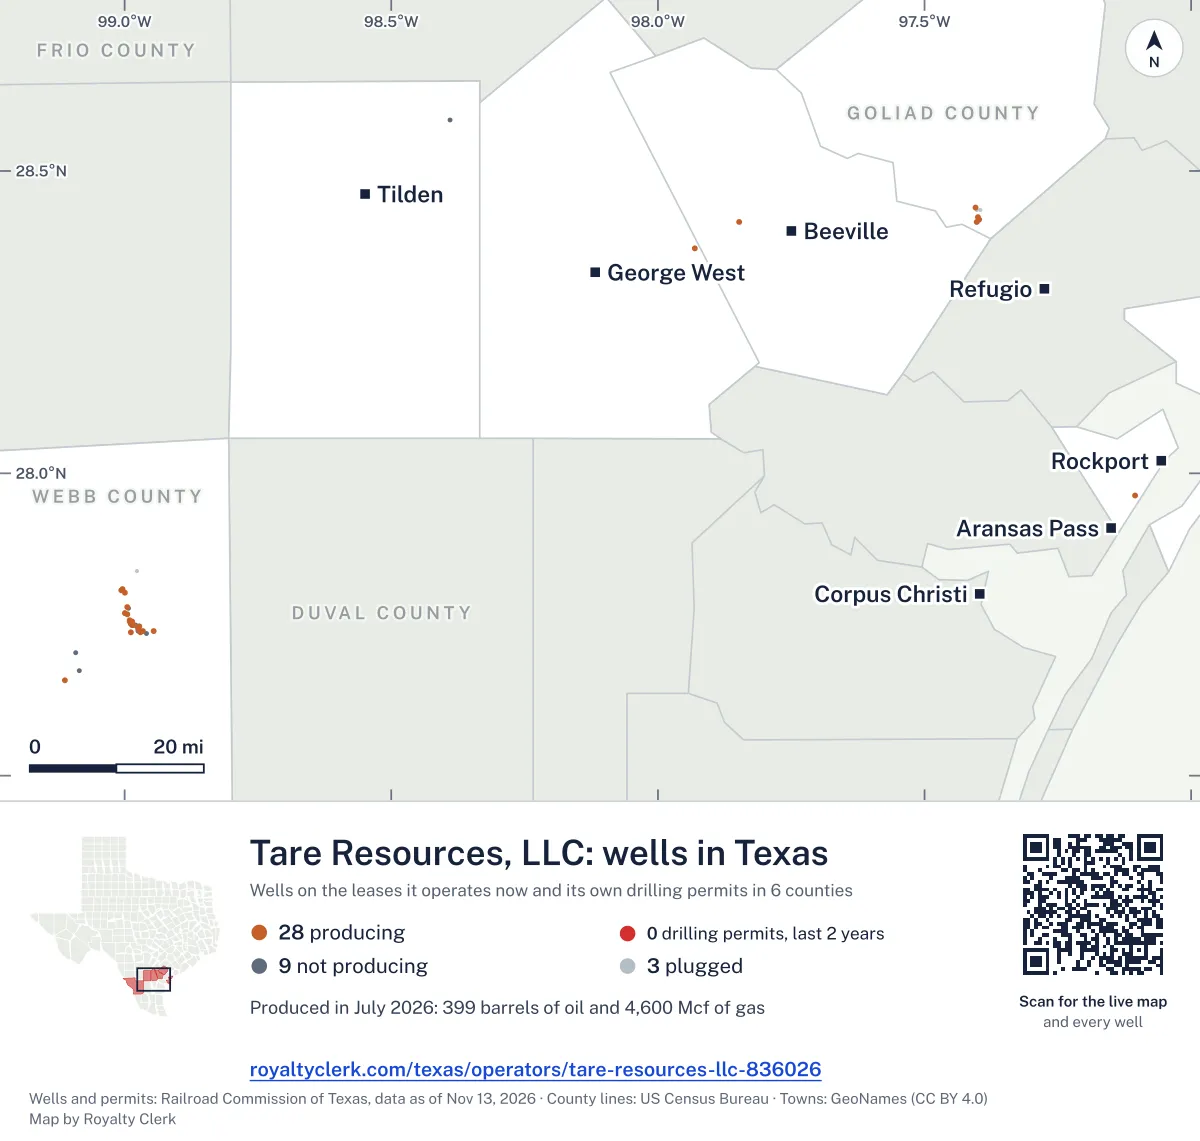
<a href="https://royaltyclerk.com/texas/operators/tare-resources-llc-836026"><img src="https://royaltyclerk.com/maps/operator-wells/tare-resources-llc-836026.svg" alt="Map of the wells of Tare Resources, LLC in Texas: 40 wells and 0 recent drilling locations, in a picture about 137 miles across." width="1000" height="951" loading="lazy" style="max-width:100%;height:auto;border:0"></a>
<p style="margin:4px 0 0;font-size:14px">Map: <a href="https://royaltyclerk.com/texas/operators/tare-resources-llc-836026">Oil and gas wells of Tare Resources, LLC in Texas</a> by Royalty Clerk, from Railroad Commission of Texas records</p>
How Tare Resources took over 34 leases in 2020
Tare Resources took over 34 leases in 2020, and gas has made more of its output than oil in every full calendar year from 2020 to 2025. Webb County holds 100.0% of its gas, while Live Oak County holds 45.7% of its oil. The Railroad Commission lists 41 wells on its leases, 38 of them active, and none are horizontal.
Gulf Coast Energy, Inc. buys from 22 leases. In the last 24 months Tare took one lease from Blue Wing Energy, Inc. and handed one lease to Sunray Marketing, LLC. Of its gas in the last 12 months, 61.6% went to a line and 38.4% was used as lease fuel.
Not a forecast, not reserves.
Key moments
- 2020Took over 34 leases from other operators in one year.
- 2021Reports 5,887 bbl of oil and 211,185 mcf of gas.
- 2022Gas falls to 157,652 mcf; oil drops to 3,838 bbl.
- 2025Takes over one more lease; gas falls to 77,494 mcf.
If you own here
- Old company, new payor
Tare took one lease from Blue Wing Energy, Inc. in the last 24 months; this follows old company names.
- Who buys my oil and gas?
Gulf Coast Energy, Inc. is the main buyer, listed on 22 leases.
- Gas royalty calculator
The gas went 61.6% to a line and 38.4% as lease fuel; this tool shows where each cost comes off.
Questions owners ask
- How many leases has Tare Resources taken over, and when?
- Tare Resources took over 34 leases in 2020 and one more lease in 2025. In the last 24 months it took one lease from Blue Wing Energy, Inc. It also handed one lease to Sunray Marketing, LLC. Old company, new payor
- Who buys the oil and gas from this operator?
- Gulf Coast Energy, Inc. is listed as the main buyer for 22 leases. In the last 12 months, 61.6% of the gas went to a line and 38.4% was used as lease fuel. Who buys my oil and gas?
- Where are this operator's leases?
- Tare Resources has 37 leases, 27 of them producing, across five Texas counties and eight fields. Vaquillas Ranch (Lobo Cons.) is the field with 16 producing leases.
- Which county produces most of this operator's gas?
- Webb County holds 100.0% of the operator's gas. In the last 12 months, Webb County reported 16,679 mcf of gas and 21 producing leases.
- Does any of this operator's lease show no recent report?
- One lease has no report for the last six months. The state data runs through July 2026, and the newest state month is August 2026.
Related pages
- Webb County
Holds 100.0% of this operator's gas, with 21 producing leases.
- Live Oak County
Holds 45.7% of this operator's oil, the largest oil share.
- Vaquillas Ranch (Lobo Cons.)
Field with 16,563 mcf of gas and 16 producing leases.
- Crow, Rebecca
The oldest producing lease, with its first report in January 1993.
From the state's records through July 2026.
How Tare Resources' oil and gas moved each year
Oil output from Tare Resources, LLC fell 33% over the last 12 months
3,209 bbl through Jul 2026, against 4,760 bbl a year earlier. Peak Oct 2024: 706 bbl.
Gas output from Tare Resources, LLC fell 89% over the last 12 months
15.5k mcf through Jul 2026, against 140k mcf a year earlier. Peak Aug 2021: 23k mcf.
SourceTexas Railroad Commission Production Data Query, operator 836026, through Jul 2026, file dated Oct 20, 2026.
Which leases Tare Resources runs, biggest first
Under each volume: change on the year before.
1,035bbl oil−20%
913bbl oil−8%
15,143mcf gas+131%
383bbl oil−44%
378bbl oil−67%
114bbl oil−50%
51bbl oil−61%
855mcf gas−88%
175mcf gas−100%
7bbl oil−46%
7bbl oil−42%
4bbl oil−50%
72mcf gas−99%
3bbl oil+50%
3bbl oil−70%
59mcf gas−100%
56mcf gas−100%
53mcf gas−100%
52mcf gas−98%
51mcf gas−100%
49mcf gas−100%
49mcf gas−100%
45mcf gas−100%
1bbl oil0%
- BRISCOE "A"
04-116446Webb CountyBriscoe (Lobo)
1bbl oil−50%
Showing 25 of 27, ranked by output value.
SourceTexas Railroad Commission Production Data Query.
Which counties and fields Tare Resources produces in
Counties, by Tare Resources, LLC oil
Live Oak County leads
Fields, by Tare Resources, LLC oil
Bolland Ranch (Hockley) leads
- Bolland Ranch (Hockley)1 lease · District 02 · Field 102873001,035bbl
- Singleton, E. (Hockley)1 lease · District 02 · Field 83740300913bbl
- Lagarto, West (1st Yegua)1 lease · District 02 · Field 51279500383bbl
- Blanconia, N. (4820)1 lease · District 02 · Field 08796696378bbl
- Vaquillas Ranch (Lobo Cons.)16 leases · District 04 · Field 93215400185bbl
- Aransas Pass, East (7930)1 lease · District 04 · Field 03350925114bbl
- Circle -B- (5000)1 lease · District 02 · Field 1824850051bbl
- Briscoe (Lobo)5 leases · District 04 · Field 1200645046bbl
Recent drilling permits filed by Tare Resources
No recent permits.
Where the gas of Tare Resources, LLC went
- Plants
- 0.0%
- Pipelines
- 62%
- Lease fuel
- 38%
- Flared or vented
- 0.0%
SourceTexas Railroad Commission Production Data Query, last 12 months. What the codes mean
Tare Resources, LLC address and phone number
This is the mailing address and phone Tare Resources, LLC filed with the Texas Railroad Commission. It is the company’s address of record with the state. It can be a regulatory office and not the desk that pays royalties, so a letter about a payment should name the owner relations or division order department, your owner number and the lease name from your stub.
Mailing address
Tare Resources, LLCPO Box 260784
Corpus Chrsti, TX 78426
Phone
State filing
RRC operator 836026 · P-5 status: Active (extension) · last filing received Jun 25, 2026
Writing about a missing or stopped check? See what to ask first or open the company record for its state registration and who buys its oil and gas.
SourceTexas Railroad Commission, P-5 Organization data, file dated Oct 22, 2026. Royalty Clerk is not affiliated with Tare Resources, LLC.