
Texas county · RRC district 04
Aransas County, Texas oil and gas
- 1,285,813mcf gas in the last 12 months
- 13producing leases
- 97wells on the map
- 4drilling locations in two years
The story
From Cabot to Lamar to Hilcorp: Aransas County's operators
Aransas County's biggest full calendar year for oil was 1994, and for gas it was 2007. In 2025, 10 operators filed reports here, against 42 in 1993, the most of any full calendar year: about a quarter as many.
Cabot Oil & Gas Corporation led the county from 2006 to 2014, with 25 leases in 2012 at its most. Lamar Oil & Gas, Inc. took the lead in 2015 with 31 leases. Hilcorp Energy Company now leads with 16 leases.
Hilcorp Energy Company reported more than three quarters of the county's oil and gas in the last 12 months: 81.4%. Only 2 of the 13 producing leases have reports back to January 1993: a little under a fifth of them. Hilcorp filed 3 drilling permits in the last 12 months, none for horizontal wells.
Not a forecast, not reserves.
Key moments
- 1994Oil reached its biggest full calendar year, 644,192 barrels.
- 2006Cabot Oil & Gas Corporation takes the lead, with 16 leases.
- 2007Gas reaches its biggest full calendar year, 13,833,189 mcf.
- 2015Lamar Oil & Gas, Inc. takes the lead with 31 leases.
- 2016Cabot hands 22 leases to Texas Independent Explor Ltd.
- 2024Texron hands 17 leases to Millennium Exploration Co. LLC.
- 2026Hilcorp Energy Company leads, with 16 leases.
Oil wells and drilling locations in Aransas County
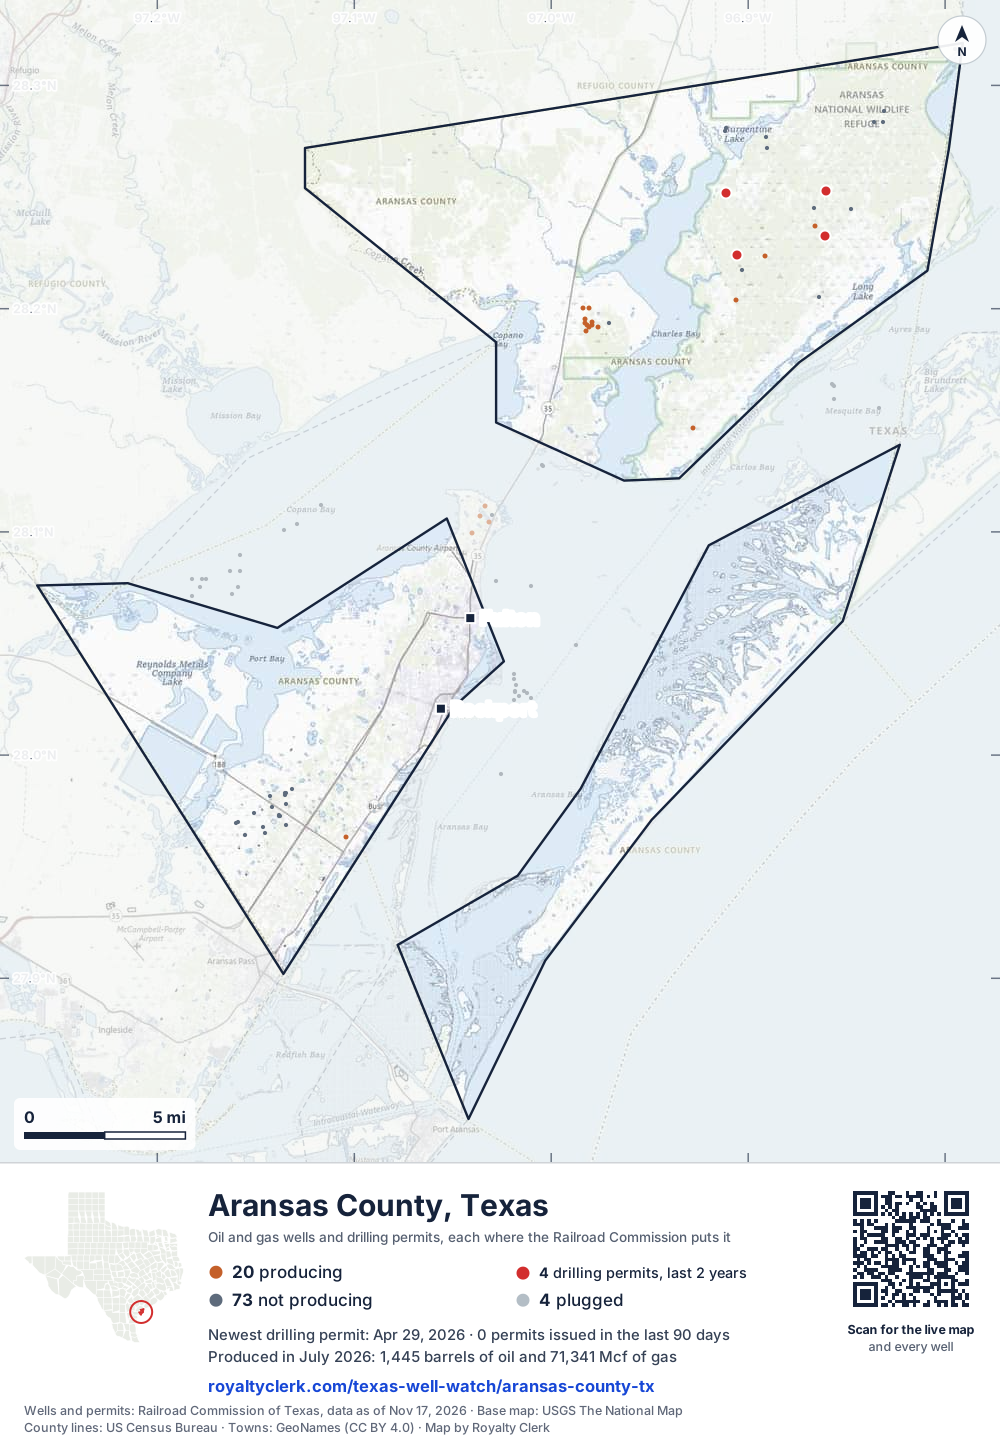
- Drilling locations4Permits issued in the last two years
- Producing wells20On a lease reporting production now
- Not producing73Shut in, inactive or no lease on record
- Plugged4The state's wellbore record says plugged
Sources: Railroad Commission of Texas well layers and permit files, US Census Bureau county outline, town points from GeoNames (CC BY 4.0), base map from USGS The National Map. A dot is a surface location; a horizontal well runs a mile or more from it.
97 wells with a location on the state's map (20 producing, 73 not producing, 4 plugged) and 4 drilling locations permitted in the last 24 months, each where the Railroad Commission puts it.
Use this map on your site
You may show this map on any site, unchanged. Keep the credit line and its link to Royalty Clerk under the map. The picture updates by itself as the state records new wells and permits.
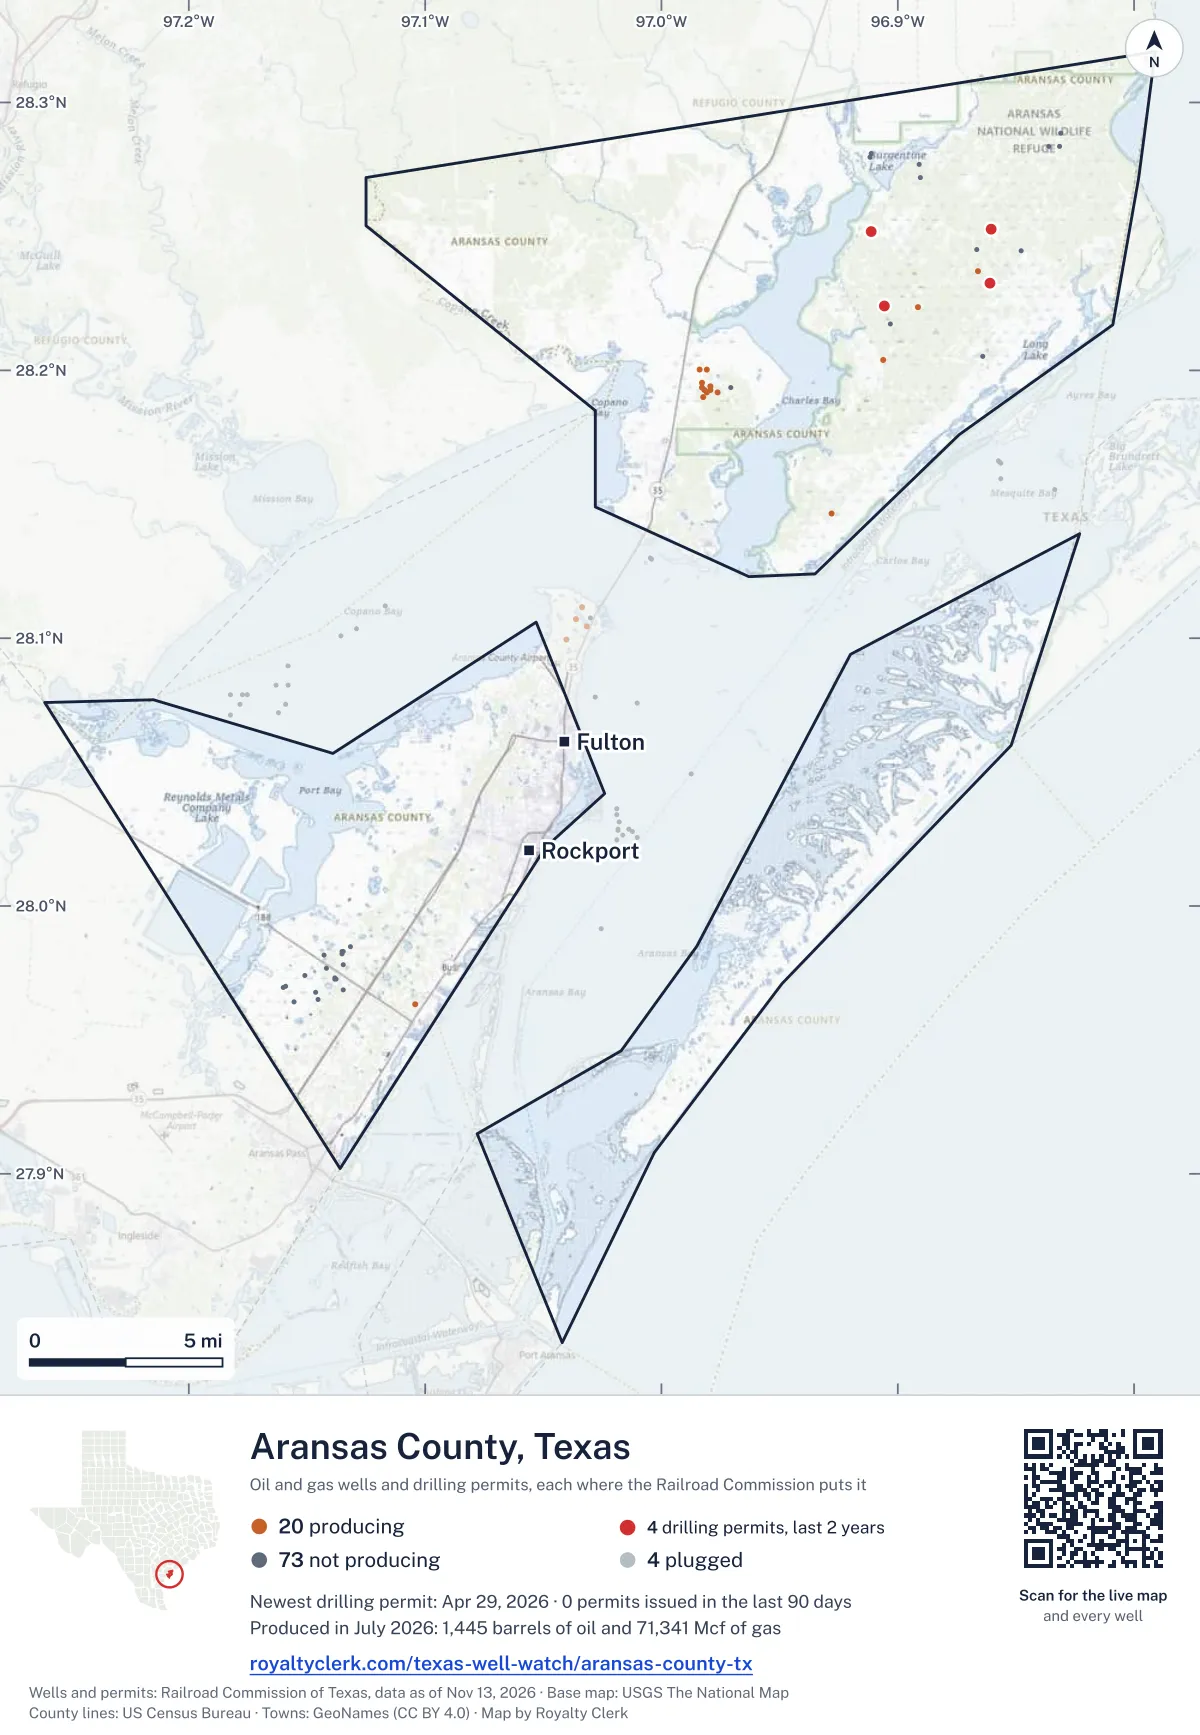
<a href="https://royaltyclerk.com/texas/counties/aransas-county-tx"><img src="https://royaltyclerk.com/maps/county-wells/aransas-county-tx.svg" alt="Map of Aransas County, Texas, with 97 oil and gas wells and 4 recent drilling locations as dots." width="1000" height="1446" loading="lazy" style="max-width:100%;height:auto;border:0"></a>
<p style="margin:4px 0 0;font-size:14px">Map: <a href="https://royaltyclerk.com/texas/counties/aransas-county-tx">Aransas County, Texas oil and gas wells</a> by Royalty Clerk, from Railroad Commission of Texas records</p>
Wells near a town: Fulton · Rockport · Newest drilling permits in Aransas County · Wells by ZIP code
Aransas County reported 1.3 million mcf of gas and 25,245 barrels of oil in the last 12 months. That ranks 143rd of 197 Texas counties by gas.
County dossier
August 2026 is still coming in. About 89% of Texas leases have reported it so far, so this page counts through July 2026 until it is fully reported.
- Producing leases
- 13of 91 on record
- Operators
- 4
- Fields
- 6
- Top operator
- Hilcorp Energy Company
Own minerals in Aransas County?
A family member owned minerals here?
Search their name: a family member who owned minerals hereWhere it sits
This county
- Oil, last 12 months
- 25,245 bbl
- Share of Texas gas
- <0.1%
- Wells on record
- 97on leases with production reports
- Data through
- Jul 2026
If you own here
- Mineral interest finder
The county roll lists 27 leases and 107 accounts for tax year 2026, so a name search finds them.
- Royalty calculator
Hilcorp Energy Company reported 81.4% of county output in the last 12 months, and gas made about nine tenths.
- Several mineral tax bills
The county roll lists 107 accounts, and each mineral tax bill is a separate account.
Questions owners ask
- Who runs the leases in Aransas County now?
- Hilcorp Energy Company leads now, with 16 leases. Hilcorp first reported in this county in 2010. Millennium Exploration Co. LLC gained 21 leases over the last 24 months, while Texron Operating, LLC shed 16 leases in the same time.
- Why did Millennium Exploration Co. LLC gain so many leases?
- Texron Operating, LLC handed 17 leases to Millennium Exploration Co. LLC in 2024, according to the state's records. Millennium first reported here in 2024, with 21 leases that year. Its name is now on the reports for 4 leases.
- How much has the county's output changed since its biggest years?
- Oil in the last 12 months is less than a tenth of 1994, its biggest full calendar year for oil: 3.9%. Gas in the last 12 months is about a tenth of 2007, its biggest full calendar year for gas: 9.3%. Mineral rights value
- Is anyone filing new drilling permits here?
- Hilcorp Energy Company filed 3 permits in the last 12 months, and none is for a horizontal well. The state's permit file shows 3 permits in 2024, 1 in 2025 and 3 in 2026. Hilcorp is the only company on the 12-month list.
- Do I own mineral rights in Aransas County?
- The county appraisal roll for tax year 2026 lists 27 leases and 107 accounts, with a total value of 12,342,720. Each account is a separate tax bill. A name search on the county mineral rolls shows the accounts and leases. Mineral interest finder
Related pages
- Hilcorp Energy Company
Leads the county now, with 16 leases and 81.4% of output.
- Wagner Oil Company
Second-largest operator now, with 18.2% of county output.
- ST. Charles (Frio Cons., Lower)
The top field now, with 4 producing leases.
From the state's records through July 2026.
Oil and gas by month over the last five years
Gas output in Aransas County fell 37% over the last 12 months
1.3M mcf through Jul 2026, against 2.1M mcf a year earlier. Peak Oct 2021: 284k mcf.
Oil output in Aransas County fell 36% over the last 12 months
25.2k bbl through Jul 2026, against 39.5k bbl a year earlier. Peak Oct 2021: 11.5k bbl.
SourceTexas Railroad Commission Production Data Query, county totals, through Jul 2026, file dated Oct 20, 2026.
Cite or embed this chart
Free to use for Aransas County, Texas, with a credit and a link. Copy what you need.
Credit line
Source: Royalty Clerk analysis of Texas Railroad Commission filings, https://royaltyclerk.com/texas/counties/aransas-county-tx, data to July 2026.
The chart on your own page
Free to embed on any site. Keep the “Source: Royalty Clerk” link under the chart.
See the code
<iframe
  src="https://royaltyclerk.com/embed/counties/aransas-county-tx"
  title="Royalty Clerk: oil and gas production, Aransas County, Texas"
  width="100%"
  height="400"
  style="border:0"
  loading="lazy"></iframe>
<p style="margin:4px 0 0;font-size:14px">Source: <a href="https://royaltyclerk.com/texas/counties/aransas-county-tx" target="_blank">Royalty Clerk</a></p>
<script>
window.addEventListener("message", function (e) {
  if (e.origin !== "https://royaltyclerk.com" || !e.data || e.data.type !== "rc-embed-height") return;
  var frames = document.getElementsByTagName("iframe");
  for (var i = 0; i < frames.length; i++) {
    if (frames[i].contentWindow === e.source && e.data.height > 0) frames[i].style.height = Number(e.data.height) + "px";
  }
});
</script>
Oil and gas each year back to January 1993
Every full year we hold, 1993 to 2025. The highest year for oil since 1993 was 1994, at 644,192 bbl. The highest year for gas was 2007, at 13,833,189 mcf.
| Year | Oilbbl | Gasmcf |
|---|---|---|
| 2025 | 41,516 | 1,846,552 |
| 2024 | 36,773 | 1,626,935 |
| 2023 | 62,485 | 1,682,823 |
| 2022 | 82,409 | 2,081,351 |
| 2021 | 121,970 | 2,630,139 |
| 2020 | 135,269 | 3,142,829 |
| 2019 | 122,246 | 3,352,196 |
| 2018 | 167,502 | 4,816,554 |
| 2017 | 242,485 | 6,255,652 |
| 2016 | 312,741 | 8,713,534 |
| 2015 | 358,237 | 12,843,288 |
| 2014 | 319,593 | 10,118,095 |
| 2013 | 210,838 | 5,646,502 |
| 2012 | 229,499 | 5,282,389 |
| 2011 | 233,552 | 5,368,484 |
| 2010 | 240,387 | 6,811,118 |
| 2009 | 346,652 | 10,984,805 |
| 2008 | 457,269 | 11,843,927 |
| 2007 | 577,170 | 13,833,189 |
| 2006 | 347,076 | 8,511,923 |
| 2005 | 195,545 | 5,890,225 |
| 2004 | 271,505 | 8,199,343 |
| 2003 | 429,502 | 10,903,740 |
| 2002 | 330,964 | 7,636,568 |
| 2001 | 322,645 | 6,599,871 |
| 2000 | 349,365 | 7,027,706 |
| 1999 | 319,231 | 5,902,614 |
| 1998 | 451,216 | 8,154,763 |
| 1997 | 440,073 | 8,685,299 |
| 1996 | 417,487 | 8,942,291 |
| 1995 | 497,168 | 8,870,645 |
| 1994 | 644,192 | 10,350,017 |
| 1993 | 587,906 | 9,144,179 |
SourceTexas Railroad Commission production records, added up by county and calendar year. Oil includes condensate; gas includes casinghead gas. The year in progress is left out until it is complete.
Which leases produce the most now
Under each volume: change on the year before.
717,986mcf gas−37%
166,723mcf gas−15%
135,449mcf gas−12%
4,251bbl oil+3%
77,889mcf gas−22%
54,862mcf gas+15%
9,215mcf gas+30%
5,258mcf gasn/a
3,300mcf gas−51%
114bbl oil−50%
97bbl oil−24%
615mcf gas+91%
335mcf gas−21%
Showing 13 of 13, ranked by output value.
SourceTexas Railroad Commission Production Data Query.
Who runs the leases, and what they produce
Operators in Aransas County, by gas
Which operators produce the most here now
Fields in Aransas County, by gas
Which fields produce the most now
More operators here
Every operator in Aransas County →Recent drilling permits, led by Hilcorp
STATE TRACT 356 #2
new drill · Hilcorp Energy Company · Aransas County
Permit 0914728 · Apr 29, 2026
ST CHARLES CO #122
new drill · Hilcorp Energy Company · Aransas County
Permit 0914727 · Apr 20, 2026
ST. CHARLES CO. #121
new drill · Hilcorp Energy Company · Aransas County
Permit 0914709 · Apr 17, 2026
ST CHARLES CO. #71
recompletion · Hilcorp Energy Company · Aransas County
Permit 0908805 · Jul 2, 2025
ST. CHARLES CO #120
new drill · Hilcorp Energy Company · Aransas County
Permit 0900093 · Jun 3, 2024
ST. CHARLES CO. #119
new drill · Hilcorp Energy Company · Aransas County
Permit 0899950 · May 30, 2024