
Texas county · RRC district 06
San Augustine County, Texas oil and gas
- 306,010,040mcf gas in the last 12 months
- 454producing leases
- 507wells on the map
- 141drilling locations in two years
Oil wells and drilling locations in San Augustine County
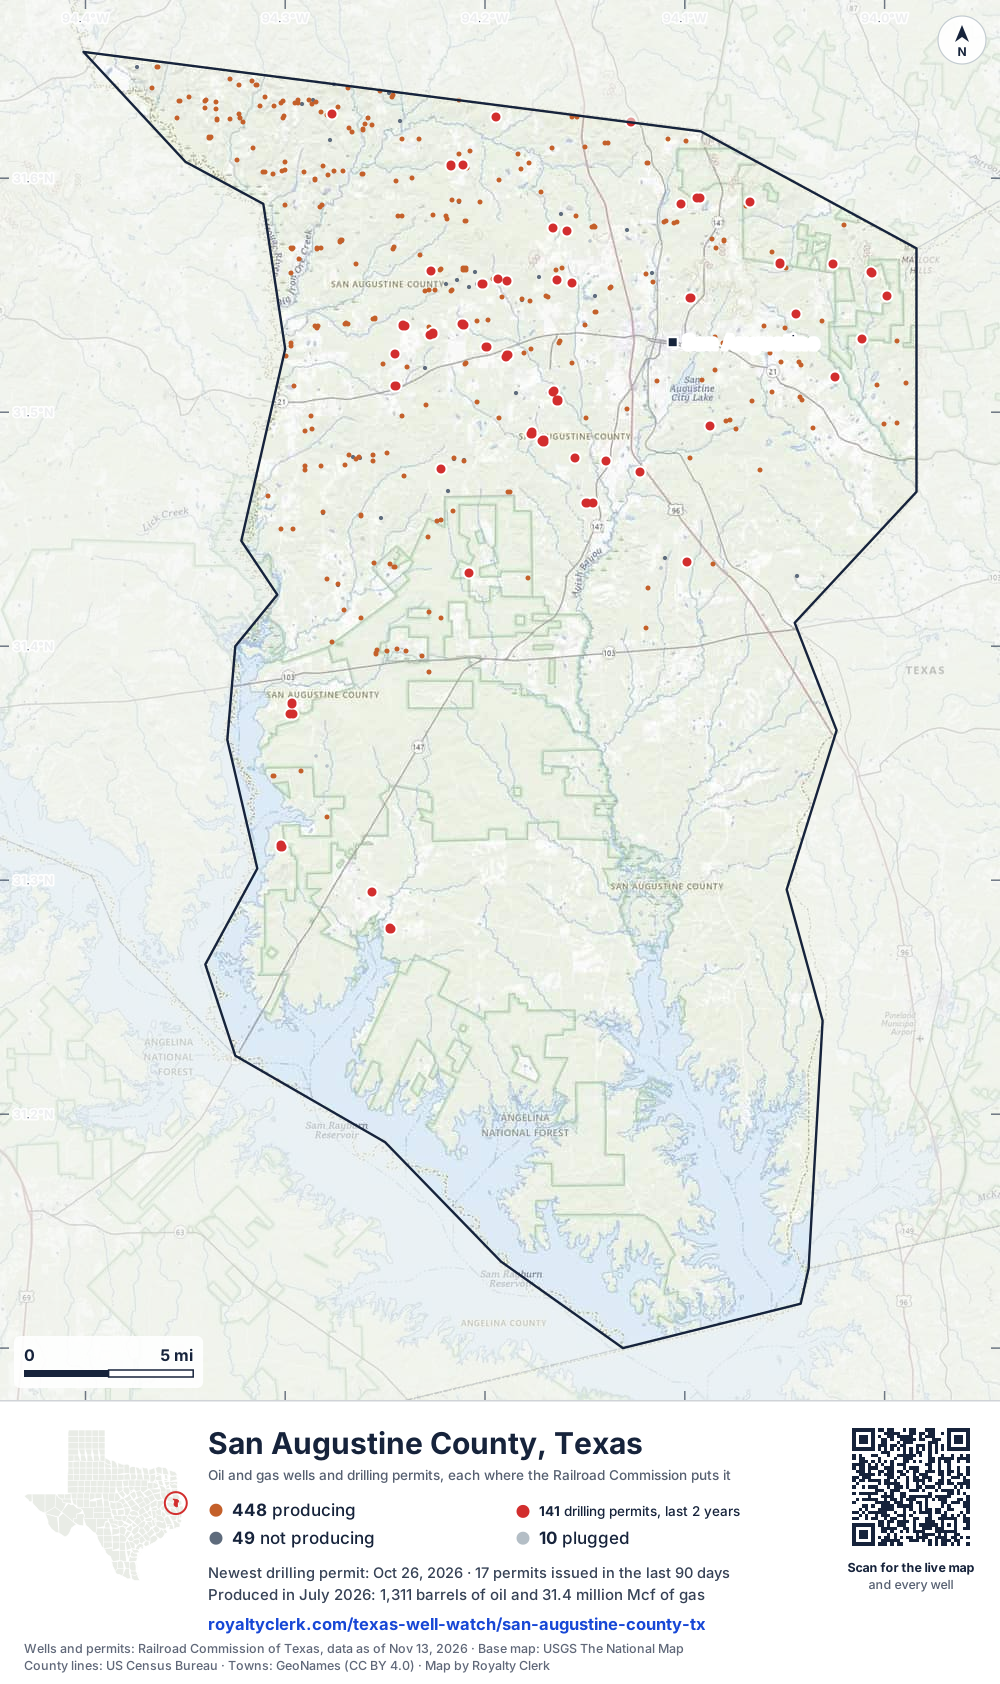
- Drilling locations141Permits issued in the last two years
- Producing wells448On a lease reporting production now
- Not producing49Shut in, inactive or no lease on record
- Plugged10The state's wellbore record says plugged
Sources: Railroad Commission of Texas well layers and permit files, US Census Bureau county outline, town points from GeoNames (CC BY 4.0), base map from USGS The National Map. A dot is a surface location; a horizontal well runs a mile or more from it.
507 wells with a location on the state's map (448 producing, 49 not producing, 10 plugged) and 141 drilling locations permitted in the last 24 months, each where the Railroad Commission puts it.
Use this map on your site
You may show this map on any site, unchanged. Keep the credit line and its link to Royalty Clerk under the map. The picture updates by itself as the state records new wells and permits.
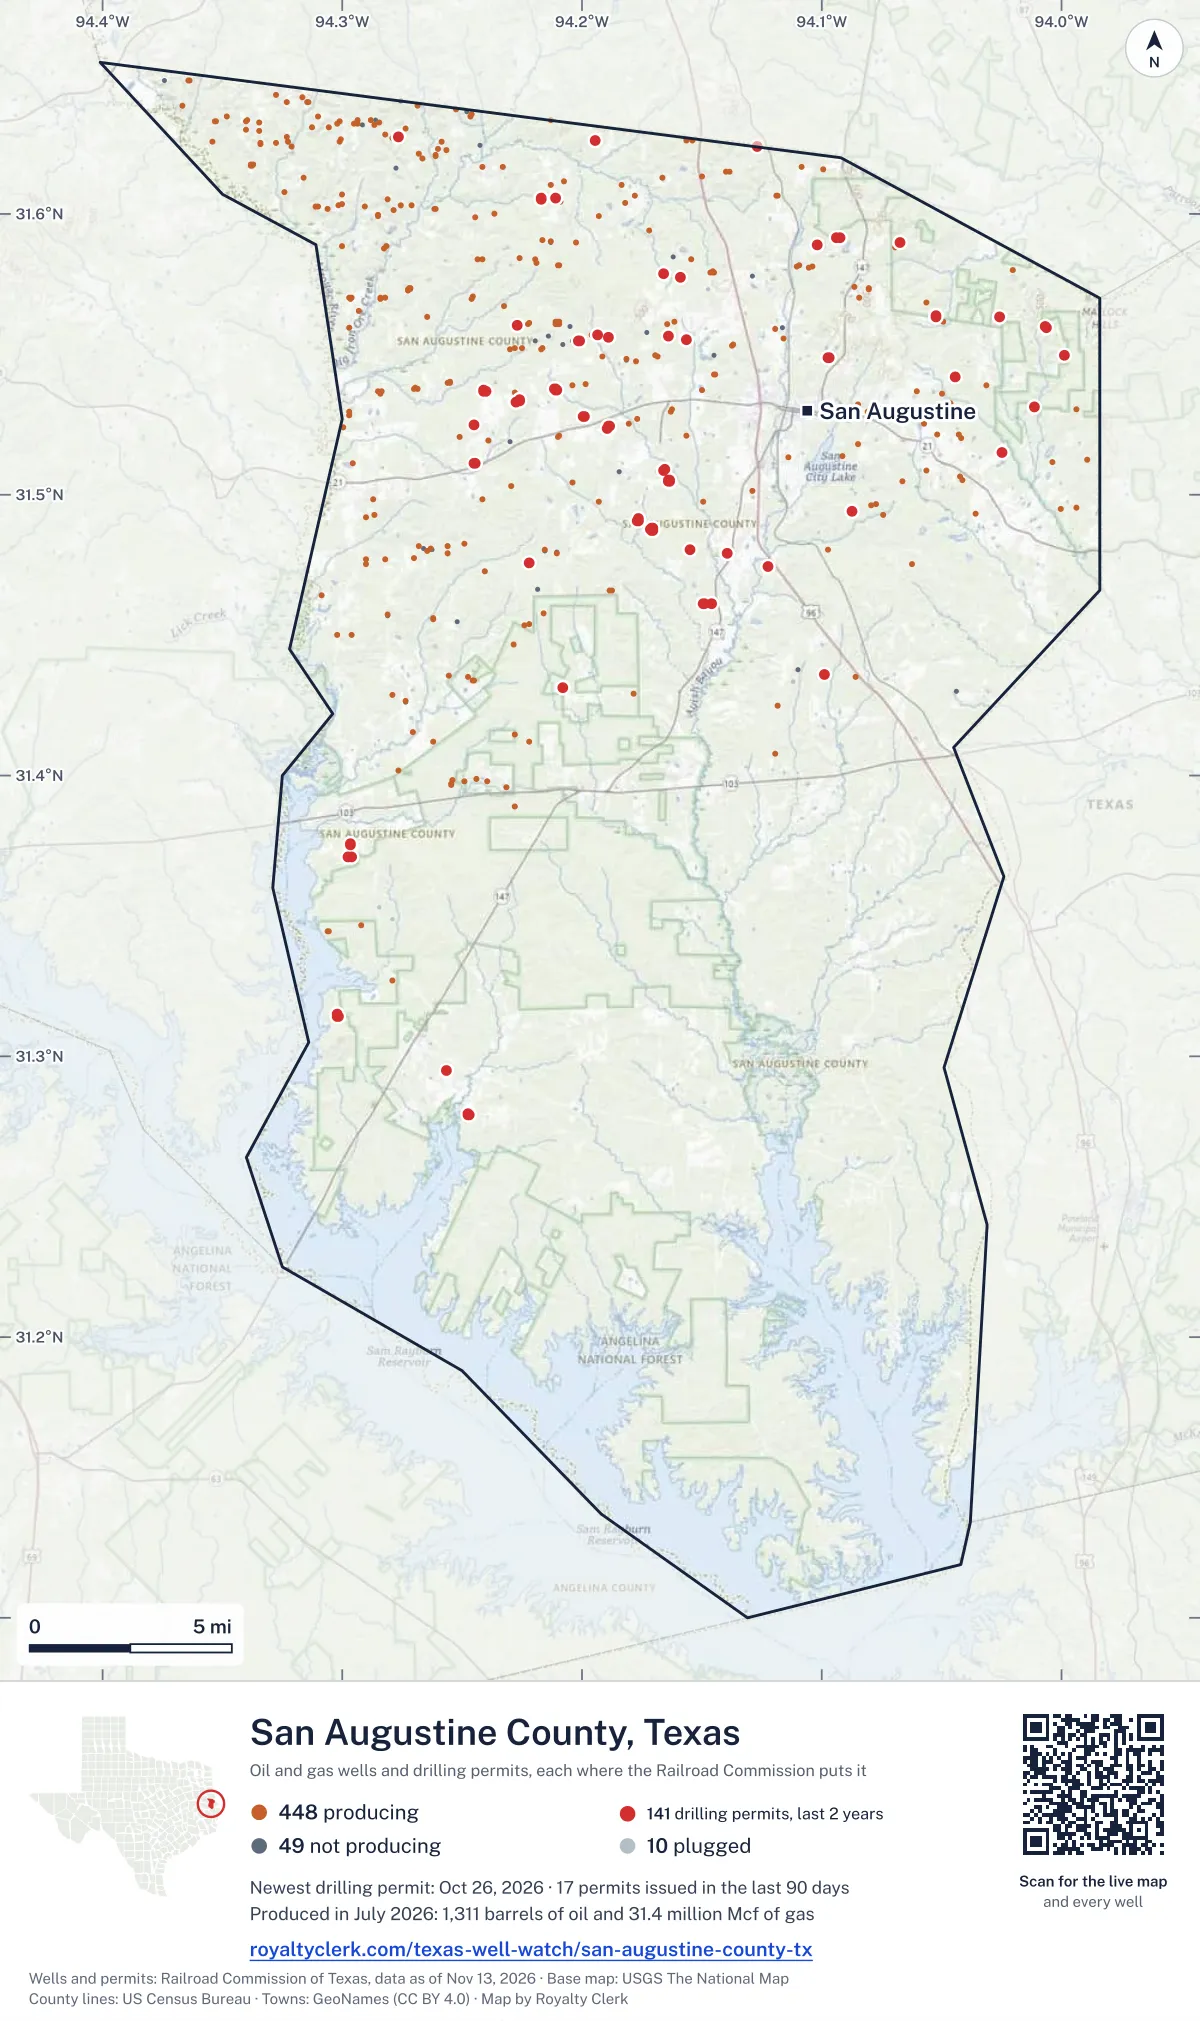
<a href="https://royaltyclerk.com/texas/counties/san-augustine-county-tx"><img src="https://royaltyclerk.com/maps/county-wells/san-augustine-county-tx.svg" alt="Map of San Augustine County, Texas, with 507 oil and gas wells and 141 recent drilling locations as dots." width="1000" height="1684" loading="lazy" style="max-width:100%;height:auto;border:0"></a>
<p style="margin:4px 0 0;font-size:14px">Map: <a href="https://royaltyclerk.com/texas/counties/san-augustine-county-tx">San Augustine County, Texas oil and gas wells</a> by Royalty Clerk, from Railroad Commission of Texas records</p>
Wells near a town: San Augustine · Newest drilling permits in San Augustine County · Wells by ZIP code
San Augustine County is one of the 10 counties of the Haynesville/Bossier Shale
San Augustine County reported 306 million mcf of gas and 13,902 barrels of oil in the last 12 months. That ranks 13th of 197 Texas counties by gas.
County dossier
August 2026 is still coming in. About 89% of Texas leases have reported it so far, so this page counts through July 2026 until it is fully reported.
- Producing leases
- 454of 517 on record
- Operators
- 10
- Fields
- 5
- Top operator
- Adamas Energy LLC
Own minerals in San Augustine County?
A family member owned minerals here?
Search their name: a family member who owned minerals hereWhere it sits
This county
- Oil, last 12 months
- 13,902 bbl
- Share of Texas gas
- 2.2%
- Wells on record
- 511on leases with production reports
- Data through
- Jul 2026
Five years of output in San Augustine County
Gas output in San Augustine County rose 15% over the last 12 months
306M mcf through Jul 2026, against 265M mcf a year earlier. Peak Jul 2026: 31M mcf.
Oil output in San Augustine County held steady over the last 12 months
13.9k bbl through Jul 2026, against 13.7k bbl a year earlier. Peak Oct 2021: 2,571 bbl.
SourceTexas Railroad Commission Production Data Query, county totals, through Jul 2026, file dated Oct 20, 2026.
Cite or embed this chart
Free to use for San Augustine County, Texas, with a credit and a link. Copy what you need.
Credit line
Source: Royalty Clerk analysis of Texas Railroad Commission filings, https://royaltyclerk.com/texas/counties/san-augustine-county-tx, data to July 2026.
The chart on your own page
Free to embed on any site. Keep the “Source: Royalty Clerk” link under the chart.
See the code
<iframe
  src="https://royaltyclerk.com/embed/counties/san-augustine-county-tx"
  title="Royalty Clerk: oil and gas production, San Augustine County, Texas"
  width="100%"
  height="400"
  style="border:0"
  loading="lazy"></iframe>
<p style="margin:4px 0 0;font-size:14px">Source: <a href="https://royaltyclerk.com/texas/counties/san-augustine-county-tx" target="_blank">Royalty Clerk</a></p>
<script>
window.addEventListener("message", function (e) {
  if (e.origin !== "https://royaltyclerk.com" || !e.data || e.data.type !== "rc-embed-height") return;
  var frames = document.getElementsByTagName("iframe");
  for (var i = 0; i < frames.length; i++) {
    if (frames[i].contentWindow === e.source && e.data.height > 0) frames[i].style.height = Number(e.data.height) + "px";
  }
});
</script>
San Augustine County oil and gas production by year, 1993 to 2025
Every full year we hold, 1993 to 2025. The highest year for oil since 1993 was 1994, at 924,503 bbl. The highest year for gas was 2021, at 304,797,438 mcf.
| Year | Oilbbl | Gasmcf |
|---|---|---|
| 2025 | 13,140 | 266,440,323 |
| 2024 | 15,403 | 281,012,440 |
| 2023 | 16,112 | 296,154,290 |
| 2022 | 21,477 | 227,283,411 |
| 2021 | 26,243 | 304,797,438 |
| 2020 | 27,632 | 221,137,928 |
| 2019 | 36,384 | 228,706,494 |
| 2018 | 43,060 | 161,504,620 |
| 2017 | 55,089 | 114,133,900 |
| 2016 | 63,715 | 99,792,515 |
| 2015 | 93,791 | 80,827,667 |
| 2014 | 192,679 | 76,173,858 |
| 2013 | 224,381 | 85,649,051 |
| 2012 | 203,330 | 128,965,676 |
| 2011 | 130,628 | 146,164,100 |
| 2010 | 115,300 | 68,111,008 |
| 2009 | 51,850 | 31,616,142 |
| 2008 | 62,547 | 14,147,510 |
| 2007 | 14,198 | 1,370,991 |
| 2006 | 6,574 | 52,031 |
| 2005 | 5,760 | 31,461 |
| 2004 | 10,953 | 37,616 |
| 2003 | 12,503 | 70,219 |
| 2002 | 10,487 | 175,797 |
| 2001 | 20,525 | 317,341 |
| 2000 | 38,120 | 547,949 |
| 1999 | 49,998 | 640,152 |
| 1998 | 81,051 | 737,880 |
| 1997 | 206,546 | 1,368,865 |
| 1996 | 403,411 | 2,426,336 |
| 1995 | 662,695 | 3,276,019 |
| 1994 | 924,503 | 3,309,064 |
| 1993 | 207,741 | 291,125 |
SourceTexas Railroad Commission production records, added up by county and calendar year. Oil includes condensate; gas includes casinghead gas. The year in progress is left out until it is complete.
San Augustine County appraisal district, 2026 mineral roll
Mineral owners in San Augustine County: 47,343 royalty records on the roll
At least 146 of the 47,343 royalty-interest records on San Augustine County's 2026 mineral roll are still titled to an estate (0.31%). We publish counts only. No owner’s name or address is on this page; to look for one family, search its name.
- Royalty-interest records, 2026 roll
- 47,343
- Still titled to an estate, at least
- 146
- Share of the roll
- 0.31%
SourceRoyalty Clerk count of the San Augustine County mineral appraisal roll of 2026, read November 2026. A record is one line of the roll, not one person.
The biggest leases in San Augustine County
Under each volume: change on the year before.
9,171,848mcf gasn/a
8,519,157mcf gasn/a
5,999,704mcf gasn/a
5,390,155mcf gasn/a
5,253,884mcf gasn/a
4,968,251mcf gasn/a
4,870,826mcf gasn/a
4,725,891mcf gasn/a
4,637,859mcf gasn/a
4,479,368mcf gasn/a
4,207,598mcf gasn/a
4,141,848mcf gas−44%
4,057,067mcf gasn/a
4,030,498mcf gas−43%
4,027,347mcf gasn/a
3,988,242mcf gasn/a
3,821,492mcf gasn/a
3,753,831mcf gasn/a
3,648,751mcf gasn/a
3,636,360mcf gasn/a
3,567,882mcf gas−27%
3,558,101mcf gas−50%
3,494,188mcf gasn/a
3,465,323mcf gasn/a
3,462,861mcf gasn/a
Showing 25 of 150 (the 150 largest of 454), ranked by output value.
SourceTexas Railroad Commission Production Data Query.
Who runs the leases, and what they produce
Operators in San Augustine County, by gas
Adamas Energy leads
- Adamas Energy LLC145 leases215Mmcf
- Rockcliff Energy Operating III28 leases42Mmcf
- XTO Energy Inc.84 leases27Mmcf
- Apex Natural Gas, LLC26 leases16Mmcf
- BPX Operating Company23 leases7.9Mmcf
- Exco Operating Company, LP66 leases5.7Mmcf
- Silver Hill Energy Operating LLC2 leases1.4Mmcf
- Merit Energy Company54 leases1.3Mmcf
Fields in San Augustine County, by gas
Carthage (Haynesville Shale) leads
- Carthage (Haynesville Shale)361 leases · District 06 · Field 16032300315Mmcf
- Angie (James Lime)82 leases · District 06 · Field 028703002Mmcf
- Huxley (6100)4 leases · District 06 · Field 4394085054.2kmcf
- Martinsville (Travis Peak)4 leases · District 06 · Field 5781470031.9kmcf
- Angie,(pettet)3 leases · District 06 · Field 0287040010.2kmcf
More operators here
Every operator in San Augustine County →Recent drilling permits in San Augustine County
CRGE #1H
new drill · horizontal · XTO Energy Inc. · San Augustine County
Permit 0917948 · Oct 26, 2026
HIGGINBOTHAM-BISON #1B
new drill · horizontal · XTO Energy Inc. · San Augustine County
Permit 0917339 · Oct 6, 2026
OLYMPIA FIELDS OS D #5HB
new drill · horizontal · Rockcliff Energy Operating III · San Augustine County
Permit 0918884 · Oct 6, 2026
OLYMPIA FIELDS OS C #4H
new drill · horizontal · Rockcliff Energy Operating III · San Augustine County
Permit 0918883 · Oct 6, 2026
OLYMPIA FIELDS OS B #3HB
new drill · horizontal · Rockcliff Energy Operating III · San Augustine County
Permit 0918882 · Oct 5, 2026
BLACK STONE #1H
new drill · horizontal · Silver Hill Energy Operating LLC · San Augustine County
Permit 0918632 · Sep 18, 2026