
Texas operatorRRC operator 248895Active
Ellis Exploration, Inc.
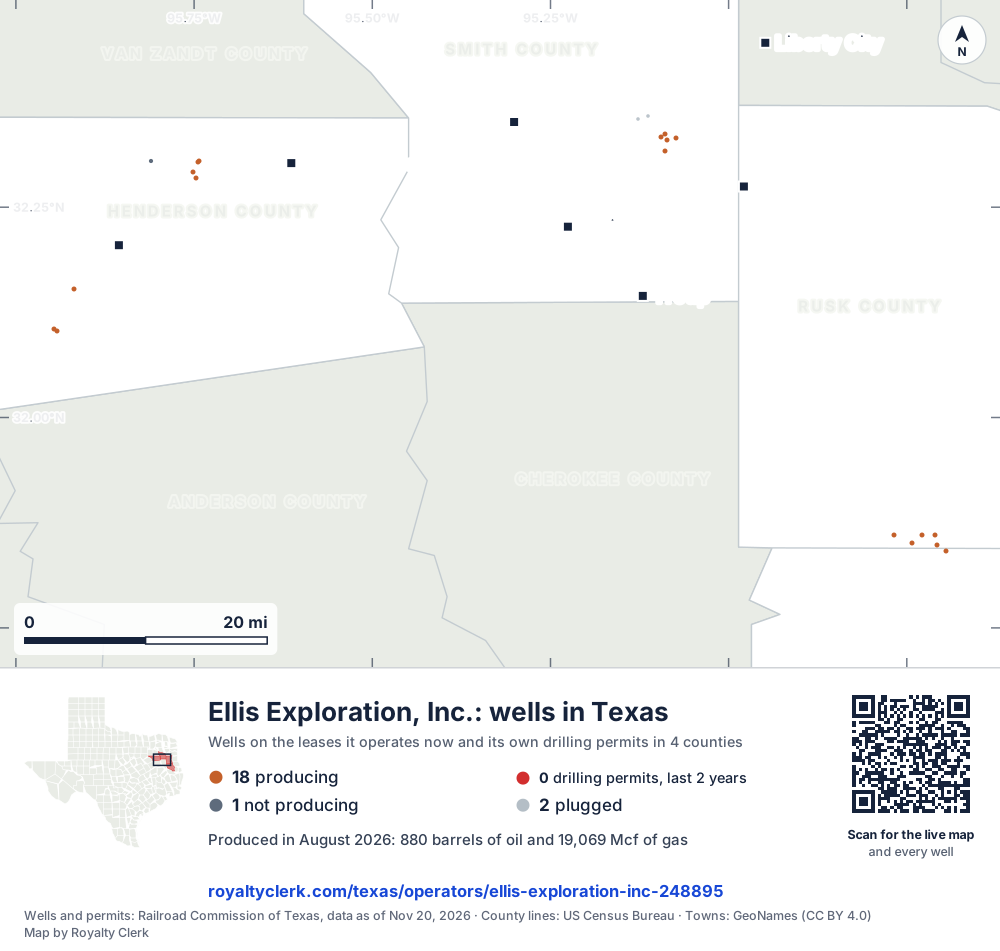
Ellis runs 18 producing leases in four Texas counties. They sold 15,488 barrels of oil in the last 12 months, through August 2026.
The story, from 404 months of reports
Gas has led Ellis Exploration's output since 2020
Gas has made more of Ellis Exploration, Inc.'s output than oil in every full calendar year from 2020 to 2025. Output is counted in barrels of oil equivalent for that comparison.
Its 18 producing leases sit in 4 counties. In the last 12 months, 98.3% of its gas went to a gas line and 1.7% was used as lease fuel. Henderson County holds 62.5% of its gas, and Rusk County holds 35.7%.
Eight leases have a record back to January 1993, and its oldest producing lease, Jackson, M., first shows a report that month. Some leases have passed to other operators: in the last 24 months, 3 went to TWS Oil and Gas LLC and 1 to Gilliland Oil and Gas, Inc.
Not a forecast, not reserves.
404 months against six other recordsNew
How output has moved since 2020
All of its leases added together are the line on top. Under it, on the same clock: the weather, the price, how many leases it ran, takeovers, the State and its buyers. Move across it.
Oil averaged $18.04 a barrel · 7 leases reporting
- TakeoverFour leases came from Roseland Oil & Gas, Inc..
Move the pointer or drag across the chart. The numbered buttons jump to each month.
Monthly production of all Ellis Exploration, Inc. leases, with the records of the same months beneath it. 404 months from January 1993 to August 2026. The most in one month: 7,212 barrels, May 2001. The newest month: 880 barrels. Moments marked: 1, Jan 1995; 2, Aug 2007; 3, Nov 2021; 4, Jun 2022; 5, Aug 2023; 6, Apr 2024.
SourcesProduction, leases, takeovers, cut-offs and buyers: Railroad Commission of Texas. Weather: NOAA. Prices: U.S. Energy Information Administration (West Texas Intermediate a barrel, Henry Hub per million Btu and, before 1997, the Texas wellhead's yearly average an mcf). Operator 248895, through August 2026, file dated Oct 20, 2026. A record in the same month is not proof of a cause.
Royalty Watch tells you the month your own lease starts to drop, with the records from that month.See Royalty Watch
Every producing lease, drawn to size
Which leases Ellis Exploration runs, biggest first
Each box is one lease. Its size is the oil it sold in the last 12 months. Its colour says whether that is more or less than the 12 months before. Tap a box to see the lease in the list.
| County | Field | barrels produced, 12 reports | on the 12 before | 24 months | Also on record | |
|---|---|---|---|---|---|---|
| Philips-Bonnville | Smith | Chapel Hill (Pettit) | 1,808 | ▼ 3.11% | Lower tax | |
| Payne | Henderson | Opelika | 1,728 | ▼ 7.84% | Lower tax | |
| Simmons | Henderson | Turlington | 35,694mcf | ▲ 58.6% | 2 silent months, 2025Lower tax | |
| Anderson, Lewis | Rusk | Trawick (Pettit-TP Cons.) | 32,168mcf | ▼ 16.7% | Lower tax | |
| Haynes | Henderson | Opelika | 1,134 | ▼ 12.6% | 2 silent months, 2024Lower tax | |
| Warren, James | Smith | Chapel Hill | 1,111 | ▼ 8.71% | Lower tax | |
| Jackson, D. W. | Smith | Chapel Hill (Rodessa) | 942 | ▲ 4.78% | Lower tax | |
| Jones | Smith | Chapel Hill (Rodessa) | 899 | ▼ 5.07% | Lower tax | |
| Jackson, M. | Rusk | MT. Enterprise (Rodessa Hill) | 19,508mcf | ▼ 2.25% | Lower tax | |
| Hogue, Harry | Henderson | Tri-Cities, Ne. (Bacon) | 769 | ▲ 45.1% | Lower tax | |
| Hayter Estate | Rusk | Trawick, N. (Pettit 7750) | 14,498mcf | ▼ 9.16% | Lower tax | |
| Temple Gas Unit #1 | Rusk | MT. Enterprise (Pettit) | 13,940mcf | ▼ 6.92% | Lower tax |
SourceTexas Railroad Commission Production Data Query, operator 248895, through August 2026. Three more leases are on record and not producing.
Where Ellis works
Which counties and fields hold its production
Counties, by Ellis oil in the last 12 months
- 1Henderson County5,304bbl7 leases · 48.4% of its oil
- 2Smith County5,121bbl5 leases · 46.7% of its oil
- 3Rusk County534bbl5 leases · 4.87% of its oil
Fields, by Ellis oil in the last 12 months
- 1Opelika3,228bbl3 leases · District 05 · Field 67416001
- 2Chapel Hill (Rodessa)1,841bbl2 leases · District 06 · Field 17008444
- 3Chapel Hill (Pettit)1,808bbl1 lease · District 06 · Field 17008222
- 4Chapel Hill1,472bbl2 leases · District 06 · Field 17008001
- 5Turlington1,300bbl2 leases · District 06 · Field 91858500
- 6Tri-Cities, Ne. (Bacon)769bbl1 lease · District 05 · Field 91109050
- 7Trawick (Pettit-TP Cons.)402bbl1 lease · District 06 · Field 90998500
- 8Trawick, N. (Pettit 7750)64bbl1 lease · District 06 · Field 91003550
When leases change handsNew
5 leases changed hands. Four went quiet.
A new operator has to set up every owner again before it can pay. A lease that also stops reporting is the one to watch: many leases end after 60 to 90 days without production unless the lease says otherwise.
of the 5 leases taken over in August 2007 reported nothing for two months or more in the year after.
of the 5 never missed a month.
of the 4 leases taken over in January 1995 missed a month.
of the 2 leases taken over in September 2009 missed a month.
of its leases have stopped reporting. The last of them reported in January 2020, and none has reported since.
Reported nothing since
- Pool, G. C.since Jan 2019 · 92 months without a report
- Oliver, Georgesince Mar 2019 · 90 months without a report
- Geesince Feb 2020 · 79 months without a report
A gap in the State’s record is not a missed payment by itself. Wells are often worked on after a takeover. It is the month to check against your own stubs.
SourceRailroad Commission production reports and operator of record by month. A lease counts as taken over when the operator of record changes from one month to the next and the operator before it reported within the year.
Royalty Watch tells you the month your lease gets a new operator, and what to send them.See Royalty Watch
Prices and tax, August 2026New
The State approved a lower tax on 18 of its 18 leases
The market price is the public benchmark. The price on your statement is the one to set beside it, and the tax line beside the rate the State approved.
The State approved a lower tax on 18 of its 18 leases
- LOW PRODUCING LEASES
- 9 leases
- LOW PRODUCING WELLS
- 9 leases
- HIGH COST GAS REDUCED TAX RATE
- 1 lease
- Rate, gas
- 6.50%
7.50% - Newest approval
- February 2025
On those leases the tax line on a statement should show the lower rate. Each lease page says which wells and until when.
Check the tax on your stubSourcesMarket: U.S. Energy Information Administration, August 2026 (West Texas Intermediate a barrel). Tax approvals: Texas Comptroller. Leases sell at different points and qualities, so prices differ for ordinary reasons too. Comptroller tax approval source date unavailable.
Watch Plus sets these prices beside the price on each of your statements, every month.See Watch Plus
Who takes the oil and gasNew
63.1% of its gas is bought by a company that shares an officer with the operator
The State lists who gathers and who buys from each lease. Company filings list who owns whom. Here they are on one drawing, for its 9 leases.
shared officer at both ends of the sale
- Etex Gas, Inc.63.1%Shares an officer with the operator · 6 leases
- Energy Transfer Company35.7%2 leases
- Xto Energy Inc.1.16%1 lease
Etex Gas, Inc. is a company that shares an officer with the operator.
Selling to a company linked to the operator is common and legal. It is also one of the first things an auditor looks at.
SourcesBuyers and gatherers: Railroad Commission Form P-4 records, weighted by each lease’s sales. Ownership: U.S. Securities and Exchange Commission filings and Railroad Commission P-5 records. Each buyer’s link is its own: a parent, officer or address shared by one buyer is never read onto another. Newest P-4 record effective September 1, 2026.
Royalty Watch tells you the day the buyer of your oil or gas changes.See Royalty Watch
Seen from space, 2025New
No repeat heat matched to this operator's leases in the records read
NOAA's VIIRS instruments record hot spots at night on the passes they make over Texas, when cloud does not hide the ground. In the readings read here for 2025, no spot that repeated near the located wells of Ellis's leases was matched to one of them. That is not a finding that its pads had no heat: a lease is looked at only where its wells have a location on file, and cloud and missed passes hide nights. A location alone does not show that the satellites saw its wells. No flaring report was matched at the leases included in the comparison for 2025. That is not a finding that it reported none: a lease with no well location on file is not compared, and a month with no report read is not counted.
lease-nights of repeat heat matched to Ellis's leases in the satellite records read for 2025: not proof of no heat, since only clear nights on the passes read are seen.
lease-month with flaring reported at the leases included in the comparison, January to December 2025. Not a count for the operator: a lease with no well location on file is not compared, and a month with no report read is not counted as a report.
Where the gas from all its leases went, Sep 2025 to Aug 2026, as Ellis reported it to the Railroad Commission
SourcesHeat: NOAA VIIRS night detections (375 m) within 500 m of a lease's located wells, counted only where the spot repeats on several nights; GOES-East readings never establish a night. Reported flaring and gas use: Railroad Commission production reports, by disposition code (what the codes mean). Cloud, missed passes and days missing from the readings hide nights, so a count of nights or lease-nights is a floor and no heat matched is not proof of none. The satellite records heat. It does not say what burned. Flaring set beside the heat (disposition code 4) is counted only at the leases included in the comparison, January to December 2025; a lease with no well location on file is not compared, and a month with no report read for a lease is not counted as a report. The gas use shares count all its leases, September 2025 to August 2026. Nights counted for January to December 2025; satellite readings read here run from February 22, 2024 through November 17, 2026. Production report file dated October 20, 2026.
Watch Plus checks whether you were paid on gas in the months heat was seen at your lease.See Watch Plus
Permits, drilling and fracsNew
Wells between permit and first production
The State's permit list, as read here, holds no drilling permit for Ellis. The dates its wells were drilled, fracked and first produced are not on file here, so this page cannot say whether a well is on the way.
SourcesPermits, drilling dates and completions: Railroad Commission of Texas. Frac dates: FracFocus chemical disclosure registry. Permit list dated November 18, 2026.
Royalty Watch tells you the day a well on your lease moves to its next stage.See Royalty Watch
On file with the Railroad Commission of Texas
Ellis Exploration, Inc. address and phone number
- Organization
- Ellis Exploration, Inc.
- Operator number
- 248895
- Status
- Active
- Mailing address
- 3800 Paluxy Dr Ste 132
Tyler, TX 75703 - Phone
- (903) 592-9955
- Last filing received
- Feb 18, 2026
- Leases on record
- 21, of which 18 producing
- First production report
- January 1993 or before
- Railroad Commission districts
- 05, 06
- Organization type
- Corporation
This is the address of record with the State. It can be a regulatory office and not the desk that pays royalties.
SourceRailroad Commission of Texas, organization (P-5) file. Record dated October 22, 2026. No address is shown for a person who operates under their own name. Royalty Clerk is not affiliated with Ellis Exploration, Inc..
From the state record
What owners ask about Ellis
- 01Did Ellis take over my lease from another company?
- 4 leases5 leases2 leasesJan 1993Aug 2026
- 9 of its 18 producing leases came from another operator. The biggest takeovers: 4 from Roseland Oil & Gas, Inc. in January 1995; 5 from Chevron Midcontinent, L.P. in August 2007; 2 from Stonewall Production Company Inc in September 2009. Each lease page shows who ran the lease in every month back to January 1993.
- Source: Railroad Commission production reports, operator of record by month.
- See the four that went quiet
- 02When is the check for August 2026 due?
- Aug 31sale month endsOct 30oil dueNov 29gas dueTODAY, NOV 20
- August 2026 is the newest month the State has posted for Ellis's leases. Texas law gives the payor until 60 days after the end of the sale month for oil and 90 for gas: the oil by October 30, 2026 and the gas by November 29, 2026, unless the lease sets another time.
- Source: Railroad Commission production reports; Texas Natural Resources Code §91.402.
- See your next three checks
- 03Who buys what Ellis produces?
- GASEtex Gas, Inc.63.1%
- Most of the gas goes to Etex Gas, Inc., which is a company that shares an officer with the operator. The buyer's price is what a royalty check is figured on.
- Source: Railroad Commission Form P-4, gatherers and purchasers.
- See every buyer
- 04Do Ellis's leases pay the full production tax?
- Gas, full rate, 9 leases7.50%Gas, lower rate, 9 leases6.50%Oil, full rate, 9 leases4.60%
- The Comptroller lists an approved lower tax on 18 of the 18 producing leases: 9 for lOW PRODUCING LEASES and 9 for lOW PRODUCING WELLS and 1 for hIGH COST GAS REDUCED TAX RATE. On the others the full 7.50% for gas and 4.60% for oil apply.
- Source: Texas Comptroller, approved severance tax exemptions.
- Check the tax on your stub
- 05Who has taken over leases from Ellis Exploration, Inc.?
- In the last 24 months, Ellis handed 3 leases to TWS Oil and Gas LLC and 1 lease to Gilliland Oil and Gas, Inc. The state records list the new operator for each of those leases. Use the lease list on this page to find the leases by name.
- Old company, new payor
- 06Who buys the gas and oil from this operator's leases?
- Etex Gas, Inc. is the main buyer, listed for 6 leases. Energy Transfer Company is listed for 2 leases, and XTO Energy Inc. is listed for 1. Buyers are listed lease by lease, so one operator can sell to several buyers.
- Who buys my oil and gas?
- 07Where does this operator's gas go?
- In the last 12 months, 98.3% of its gas went to a gas line. The other 1.7% was lease fuel, gas used on the lease itself. The total for those months is 218,853 mcf.
- Gas royalty calculator
From the State’s records through July 2026.
Do your Ellis checks match the State?
Paid by Ellis? Add your leases to My leases and see your share of every month.
Example
A whole month was never paid
The State shows 28,175 barrels of oil sold from the lease in the month its operator changed from Operator A to Operator B, so the owner's share is 27.51 barrels. No statement covers that month.
Ask Operator B's owner relations: is that month held in suspense after the change of operator?
$2,277oil and gas
A sample finding, from our example check.
Around this operator
Nearby
Other operators in Henderson County
- Urban Oil & Gas Group, LLC5,594 bbl, 12 months
- Highmark Energy Operating, LLC84K bbl, 12 months
- Smackover Oil Treaters, Ltd.83K bbl, 12 months
- HD Operating Co, LLC28K bbl, 12 months
- Maximus Operating, Ltd.10K bbl, 12 months
Counties where Ellis works
- Henderson County7 Ellis leases
- Smith County5 Ellis leases
- Rusk County5 Ellis leases
- Nacogdoches County1 Ellis lease
Fields where Ellis works
- Opelika3 Ellis leases
- Turlington2 Ellis leases
- Tri-Cities, Ne. (Bacon)1 Ellis lease
- Chapel Hill (Rodessa)2 Ellis leases
- Chapel Hill (Pettit)1 Ellis lease
Related pages
- Henderson CountyHenderson County holds 62.5% of this operator's gas.
- Rusk CountyRusk County holds 35.7% of its gas across 5 producing leases.
- OpelikaOpelika field: 3 producing leases and 56,912 mcf of gas.
- Jackson, M.Its oldest producing lease, first showing a report in January 1993.
Where this page comes from
- Railroad Commission of Texas production, Form P-4, Form P-5, permits, wells
- Texas Comptroller tax approvals, lease prices
- U.S. Energy Information Administration prices
- SEC EDGAR company filings
- FracFocus frac dates
- NOAA storms and cold
- NOAA VIIRS night heat
- U.S. Census Bureau county shapes