
Texas county · RRC district 06
Smith County, Texas oil and gas
- 1,166,659bbl oil in the last 12 months
- 659producing leases
- 1,305wells on the map
- 31drilling locations in two years
The story
Who has run Smith County's leases since 2002
Gas has made more of Smith County's output than oil in every full calendar year from 1993 to 2025.
Southwestern Energy Prod. Co. became the leading operator in 2002, and its leases grew from 45 that year to 300 in 2006, the year of the county's most gas in a full calendar year.
Leases then passed from one operator to the next. Linn Operating, Riviera Operating and Faulconer Energy each took over hundreds of leases from the operator before. Faulconer Energy, LLC runs 391 leases here now, and Diversified Production LLC took 112 leases from Breitburn Operating L.P. in 2024.
Not a forecast, not reserves.
Key moments
- 2002Southwestern Energy Prod. Co. took the lead with 45 leases.
- 2004Southwestern's leading lease count reached 175; 141 leases started.
- 2006Most gas in a full calendar year: 60,496,261 mcf.
- 2012Linn Operating, Inc. took over 373 leases from Southwestern Energy Prod. Co.
- 2019Riviera Operating, LLC took over 382 leases from Linn Operating, LLC.
- 2021Faulconer Energy, LLC took over 380 leases from Faulconer, Vernon E., Inc.
- 2024Diversified Production LLC took over 112 leases from Breitburn Operating L.P.
Oil wells and drilling locations in Smith County
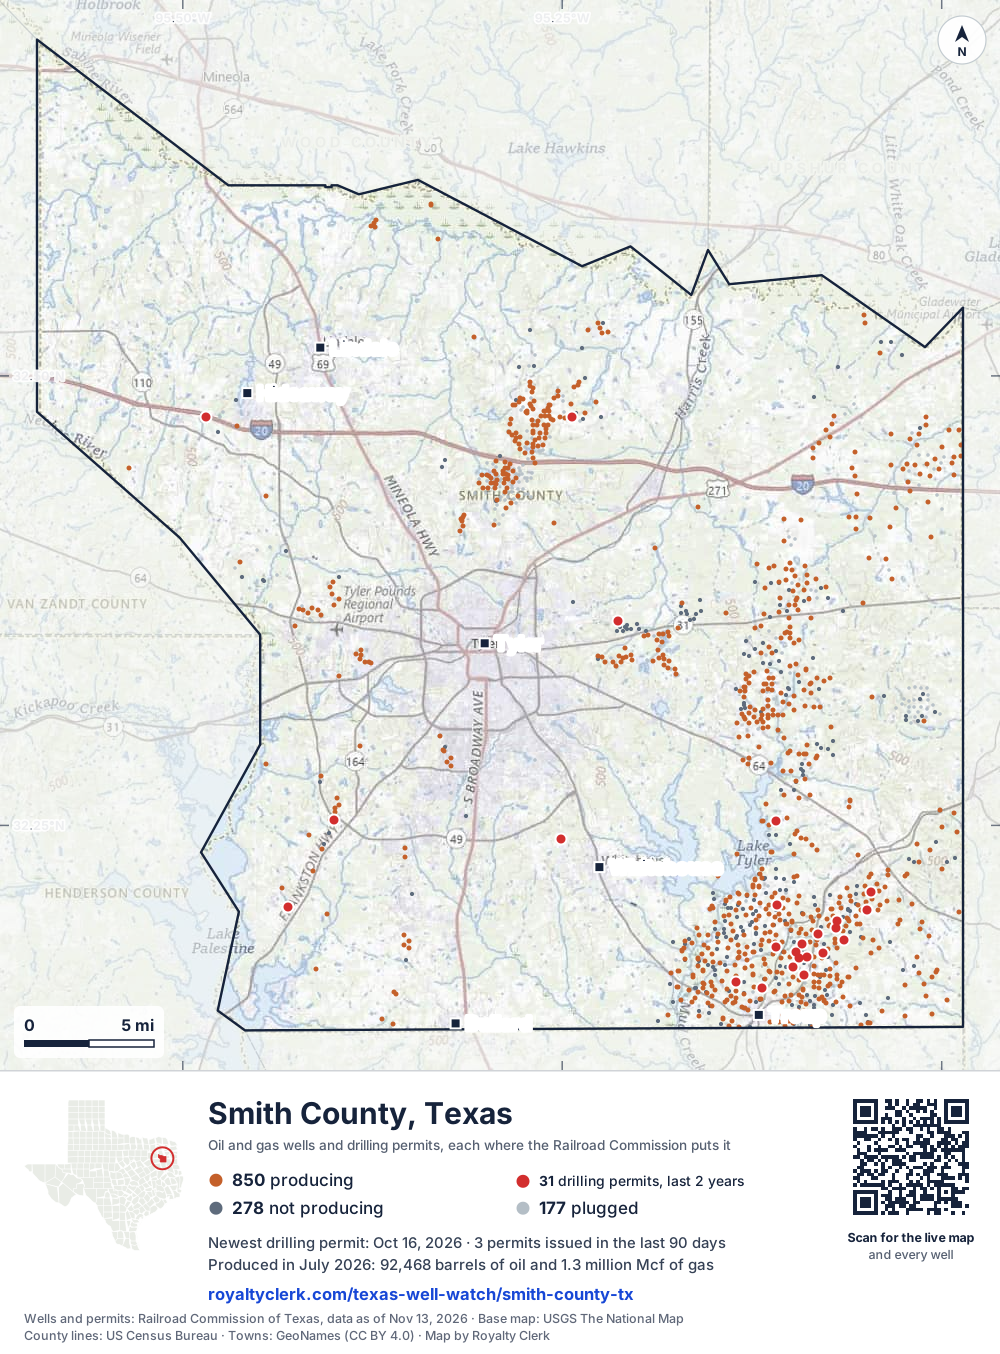
- Drilling locations31Permits issued in the last two years
- Producing wells850On a lease reporting production now
- Not producing277Shut in, inactive or no lease on record
- Plugged178The state's wellbore record says plugged
Sources: Railroad Commission of Texas well layers and permit files, US Census Bureau county outline, town points from GeoNames (CC BY 4.0), base map from USGS The National Map. A dot is a surface location; a horizontal well runs a mile or more from it.
1,305 wells with a location on the state's map (850 producing, 277 not producing, 178 plugged) and 31 drilling locations permitted in the last 24 months, each where the Railroad Commission puts it.
Use this map on your site
You may show this map on any site, unchanged. Keep the credit line and its link to Royalty Clerk under the map. The picture updates by itself as the state records new wells and permits.
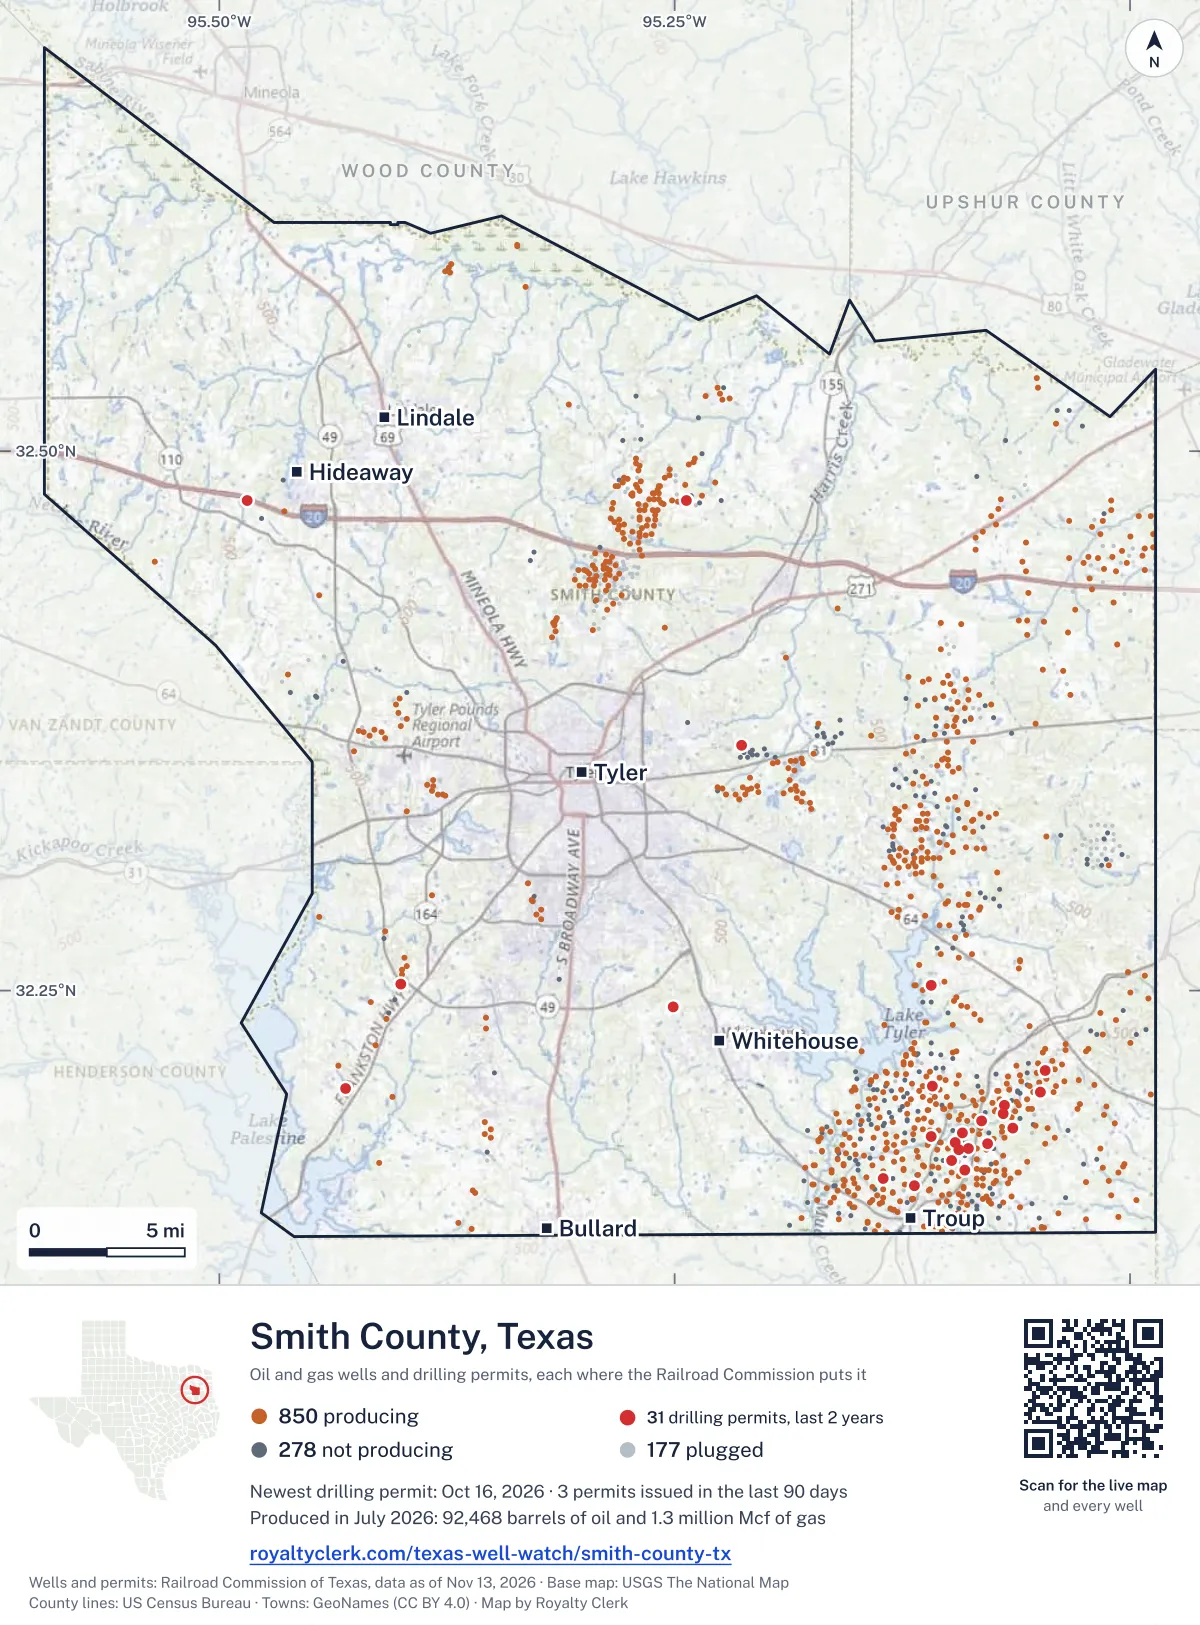
<a href="https://royaltyclerk.com/texas/counties/smith-county-tx"><img src="https://royaltyclerk.com/maps/county-wells/smith-county-tx.svg" alt="Map of Smith County, Texas, with 1,305 oil and gas wells and 31 recent drilling locations as dots." width="1000" height="1354" loading="lazy" style="max-width:100%;height:auto;border:0"></a>
<p style="margin:4px 0 0;font-size:14px">Map: <a href="https://royaltyclerk.com/texas/counties/smith-county-tx">Smith County, Texas oil and gas wells</a> by Royalty Clerk, from Railroad Commission of Texas records</p>
Wells near a town: Bullard · Hideaway · Lindale · Troup · Tyler · Whitehouse · Newest drilling permits in Smith County · Wells by ZIP code
Smith County reported 1.2 million barrels of oil and 14 million mcf of gas in the last 12 months. That ranks 65th of 225 Texas counties by oil.
County dossier
August 2026 is still coming in. About 89% of Texas leases have reported it so far, so this page counts through July 2026 until it is fully reported.
- Producing leases
- 659of 1,009 on record
- Operators
- 52
- Fields
- 76
- Top operator
- Valence Operating Company
Own minerals in Smith County?
A family member owned minerals here?
Search their name: a family member who owned minerals hereWhere it sits
This county
- Gas, last 12 months
- 14,014,610 mcf
- Share of Texas oil
- <0.1%
- Wells on record
- 1,312on leases with production reports
- Data through
- Jul 2026
If you own here
- Royalty calculator
Gas made 66.7% of the county's output in the last 12 months. Turns volume and decimal into an estimated check, with costs and tax.
- Mineral rights value
Gas in the last 12 months is about a quarter of 2006: 23.2%. Gives last-year income and a value range.
- Mineral interest finder
46 leases here carry an estate, heirs or trust name. Searches a name on county mineral rolls for accounts and leases.
Questions owners ask
- Who runs most of the leases in Smith County now?
- Faulconer Energy, LLC reports 391 leases in Smith County through July 2026, out of 897 leases reporting. Faulconer, Vernon E., Inc. handed it 380 leases in 2021. Faulconer Energy has been the leading operator in the county since 2021.
- How many leases here list an estate, heirs or trust name?
- 46 leases in Smith County carry an estate, heirs or trust name. These are county totals only, and no lease or owner is named here. A search of a name on the county mineral rolls can show the accounts and leases tied to that name. Mineral interest finder
- How much has gas output changed since 2006?
- Gas in the last 12 months is about a quarter of 2006, its biggest full calendar year for gas: 23.2%. The last 12 months total 14,014,610 mcf, against 60,496,261 mcf in 2006. Gas is counted in mcf, or thousand cubic feet. Mineral rights value
- Which operators filed the most drilling permits here recently?
- Faulconer Energy, LLC filed 10 of the 19 drilling permits in the last 12 months. Sabine Energy Inc. filed 4 and Valence Operating Company filed 3. Seven of the 19 permits are for horizontal wells: a little over a third of them. Find the land on my deed
Related pages
- Faulconer Energy, LLC
Runs 391 leases here and reports 20.3% of county output.
- Diversified Production LLC
Took over 112 leases from Breitburn Operating L.P. in 2024.
- Sabine Energy Inc.
Reports 24.1% of county output from four producing leases.
- Overton (Cotton Valley Sand)
The top field, with 340 producing leases now.
- Valence Operating Company
Reports 12.0% of county output from 48 producing leases.
From the state's records through July 2026.
How Smith County's oil and gas moved over five years
Oil output in Smith County held steady over the last 12 months
1.2M bbl through Jul 2026, against 1.1M bbl a year earlier. Peak Jan 2023: 129k bbl.
Gas output in Smith County rose 13% over the last 12 months
14M mcf through Jul 2026, against 12M mcf a year earlier. Peak Dec 2022: 1.6M mcf.
SourceTexas Railroad Commission Production Data Query, county totals, through Jul 2026, file dated Oct 20, 2026.
Cite or embed this chart
Free to use for Smith County, Texas, with a credit and a link. Copy what you need.
Credit line
Source: Royalty Clerk analysis of Texas Railroad Commission filings, https://royaltyclerk.com/texas/counties/smith-county-tx, data to July 2026.
The chart on your own page
Free to embed on any site. Keep the “Source: Royalty Clerk” link under the chart.
See the code
<iframe
  src="https://royaltyclerk.com/embed/counties/smith-county-tx"
  title="Royalty Clerk: oil and gas production, Smith County, Texas"
  width="100%"
  height="400"
  style="border:0"
  loading="lazy"></iframe>
<p style="margin:4px 0 0;font-size:14px">Source: <a href="https://royaltyclerk.com/texas/counties/smith-county-tx" target="_blank">Royalty Clerk</a></p>
<script>
window.addEventListener("message", function (e) {
  if (e.origin !== "https://royaltyclerk.com" || !e.data || e.data.type !== "rc-embed-height") return;
  var frames = document.getElementsByTagName("iframe");
  for (var i = 0; i < frames.length; i++) {
    if (frames[i].contentWindow === e.source && e.data.height > 0) frames[i].style.height = Number(e.data.height) + "px";
  }
});
</script>
Smith County oil and gas year by year from January 1993
Every full year we hold, 1993 to 2025. The highest year for oil since 1993 was 1993, at 2,409,973 bbl. The highest year for gas was 2006, at 60,496,261 mcf.
| Year | Oilbbl | Gasmcf |
|---|---|---|
| 2025 | 1,141,414 | 11,532,712 |
| 2024 | 1,215,722 | 14,226,618 |
| 2023 | 1,360,828 | 16,788,778 |
| 2022 | 1,371,244 | 15,079,513 |
| 2021 | 1,114,410 | 16,442,243 |
| 2020 | 1,512,251 | 23,986,689 |
| 2019 | 1,611,518 | 23,506,545 |
| 2018 | 1,310,357 | 17,925,411 |
| 2017 | 1,172,910 | 18,528,345 |
| 2016 | 1,259,017 | 22,338,437 |
| 2015 | 1,417,890 | 22,145,233 |
| 2014 | 1,525,105 | 17,853,361 |
| 2013 | 1,418,318 | 18,787,596 |
| 2012 | 1,437,644 | 20,899,991 |
| 2011 | 1,220,337 | 24,402,133 |
| 2010 | 1,321,955 | 29,080,748 |
| 2009 | 1,344,949 | 34,778,386 |
| 2008 | 1,439,494 | 42,623,056 |
| 2007 | 1,543,107 | 50,230,690 |
| 2006 | 1,676,581 | 60,496,261 |
| 2005 | 1,639,167 | 53,342,824 |
| 2004 | 1,607,780 | 41,949,854 |
| 2003 | 1,548,186 | 26,871,664 |
| 2002 | 1,250,967 | 15,213,759 |
| 2001 | 1,217,897 | 10,592,454 |
| 2000 | 1,228,593 | 8,384,558 |
| 1999 | 1,357,147 | 8,981,226 |
| 1998 | 1,659,141 | 10,862,538 |
| 1997 | 1,773,008 | 11,864,491 |
| 1996 | 2,007,507 | 14,133,236 |
| 1995 | 2,050,910 | 14,341,032 |
| 1994 | 2,143,902 | 15,743,642 |
| 1993 | 2,409,973 | 19,255,668 |
SourceTexas Railroad Commission production records, added up by county and calendar year. Oil includes condensate; gas includes casinghead gas. The year in progress is left out until it is complete.
Smith County appraisal district, 2026 mineral roll
What the 2026 appraisal roll shows for Smith County
At least 212 of the 24,008 royalty-interest records on Smith County's 2026 mineral roll are still titled to an estate (0.88%). We publish counts only. No owner’s name or address is on this page; to look for one family, search its name.
- Royalty-interest records, 2026 roll
- 24,008
- Still titled to an estate, at least
- 212
- Share of the roll
- 0.88%
SourceRoyalty Clerk count of the Smith County mineral appraisal roll of 2026, read November 2026. A record is one line of the roll, not one person.
Which Smith County leases produce the most now
Under each volume: change on the year before.
2,716,972mcf gasn/a
93,294bbl oil−3%
84,205bbl oiln/a
78,046bbl oiln/a
54,114bbl oil−23%
1,135,955mcf gasn/a
35,200bbl oil+2%
34,399bbl oil+54%
30,708bbl oil−10%
713,655mcf gas−37%
28,639bbl oil−52%
28,002bbl oil−14%
25,241bbl oil−8%
23,609bbl oil−16%
447,508mcf gas−36%
18,361bbl oil−9%
17,670bbl oil−15%
16,734bbl oil−7%
385,384mcf gas−31%
14,374bbl oil−46%
13,156bbl oil−22%
12,970bbl oil−2%
12,429bbl oil−25%
279,697mcf gas−7%
260,584mcf gas−29%
Showing 25 of 150 (the 150 largest of 659), ranked by output value.
SourceTexas Railroad Commission Production Data Query.
Who runs the leases, and what they produce
Operators in Smith County, by oil
Which operators report the most output in Smith County
- Valence Operating Company48 leases303kbbl
- Vess Oil Corporation4 leases151kbbl
- Faulconer Energy, LLC285 leases117kbbl
- Maximus Operating, Ltd.2 leases89.3kbbl
- Diversified Production LLC91 leases72.4kbbl
- Linder, John Operating Co., LLC48 leases71kbbl
- Goldston Oil Corporation8 leases68.5kbbl
- Culver & Cain Production LLC6 leases57.9kbbl
Fields in Smith County, by oil
Which Smith County fields produce the most now
- Girlie Caldwell (Goodland LM)14 leases · District 06 · Field 35060500274kbbl
- Overton (Travis Peak)43 leases · District 06 · Field 67849500119kbbl
- Sand Flat2 leases · District 06 · Field 8045900198.5kbbl
- Hitts Lake, North (Paluxy)3 leases · District 06 · Field 4171650057.3kbbl
- Crow (Paluxy, Lower)1 lease · District 06 · Field 2197141054.1kbbl
- Chapel Hill (Cotton Valley)29 leases · District 06 · Field 1700805052.2kbbl
- Overton (Cotton Valley Sand)340 leases · District 06 · Field 6784915047.8kbbl
- Loretta Rose (Paluxy)1 lease · District 06 · Field 5493127035.2kbbl
More operators here
Where drilling permits in Smith County stand now
WALDROP 4 #1
recompletion · Faulconer Energy, LLC · Smith County
Permit 0919308 · Oct 16, 2026
MILTON ANDERSON 9 #1
recompletion · Faulconer Energy, LLC · Smith County
Permit 0919295 · Oct 16, 2026
OVERTON 302 #1
recompletion · Faulconer Energy, LLC · Smith County
Permit 0918936 · Oct 8, 2026
ALLRED 1 #1
recompletion · Faulconer Energy, LLC · Smith County
Permit 0917500 · Aug 6, 2026
WILSON VERNON 6 #1
recompletion · Faulconer Energy, LLC · Smith County
Permit 0917141 · Jul 10, 2026
KICKAPOO CREEK GAS UNIT #6
recompletion · Faulconer Energy, LLC · Smith County
Permit 0915496 · Jun 2, 2026