
Texas county · RRC district 03
Colorado County, Texas oil and gas
- 6,526,989mcf gas in the last 12 months
- 152producing leases
- 397wells on the map
- 5drilling locations in two years
The story
Who has led Colorado County since 2024
Remora Management, LLC now leads Colorado County, after taking over 74 leases from XTO Energy Inc. in 2024.
Gas has made more of the county's output than oil in every full calendar year from 1993 to 2025. Oil reached its biggest full calendar year in 1997, and gas in 1999.
Operators reporting here fell from 111 in 1993 to 54 in 2025. Leases reporting fell from 569 in 2001 to 282 in 2025, and 152 leases are producing now. Operators filed 4 drilling permits in the last 12 months, and none were horizontal.
Not a forecast, not reserves.
Key moments
- 1997Oil reached 1,052,334 barrels, the biggest full calendar year for oil.
- 1999Gas reached 45,035,389 mcf, the biggest full calendar year for gas.
- 2000Hilcorp Energy Company became the leading operator, with 90 leases.
- 2001569 leases reported, the most of any full calendar year.
- 2007XTO Energy Inc. took 76 leases from Dominion and became leading operator.
- 2024Remora Management, LLC took 74 leases from XTO and became leading operator.
Oil wells and drilling locations in Colorado County
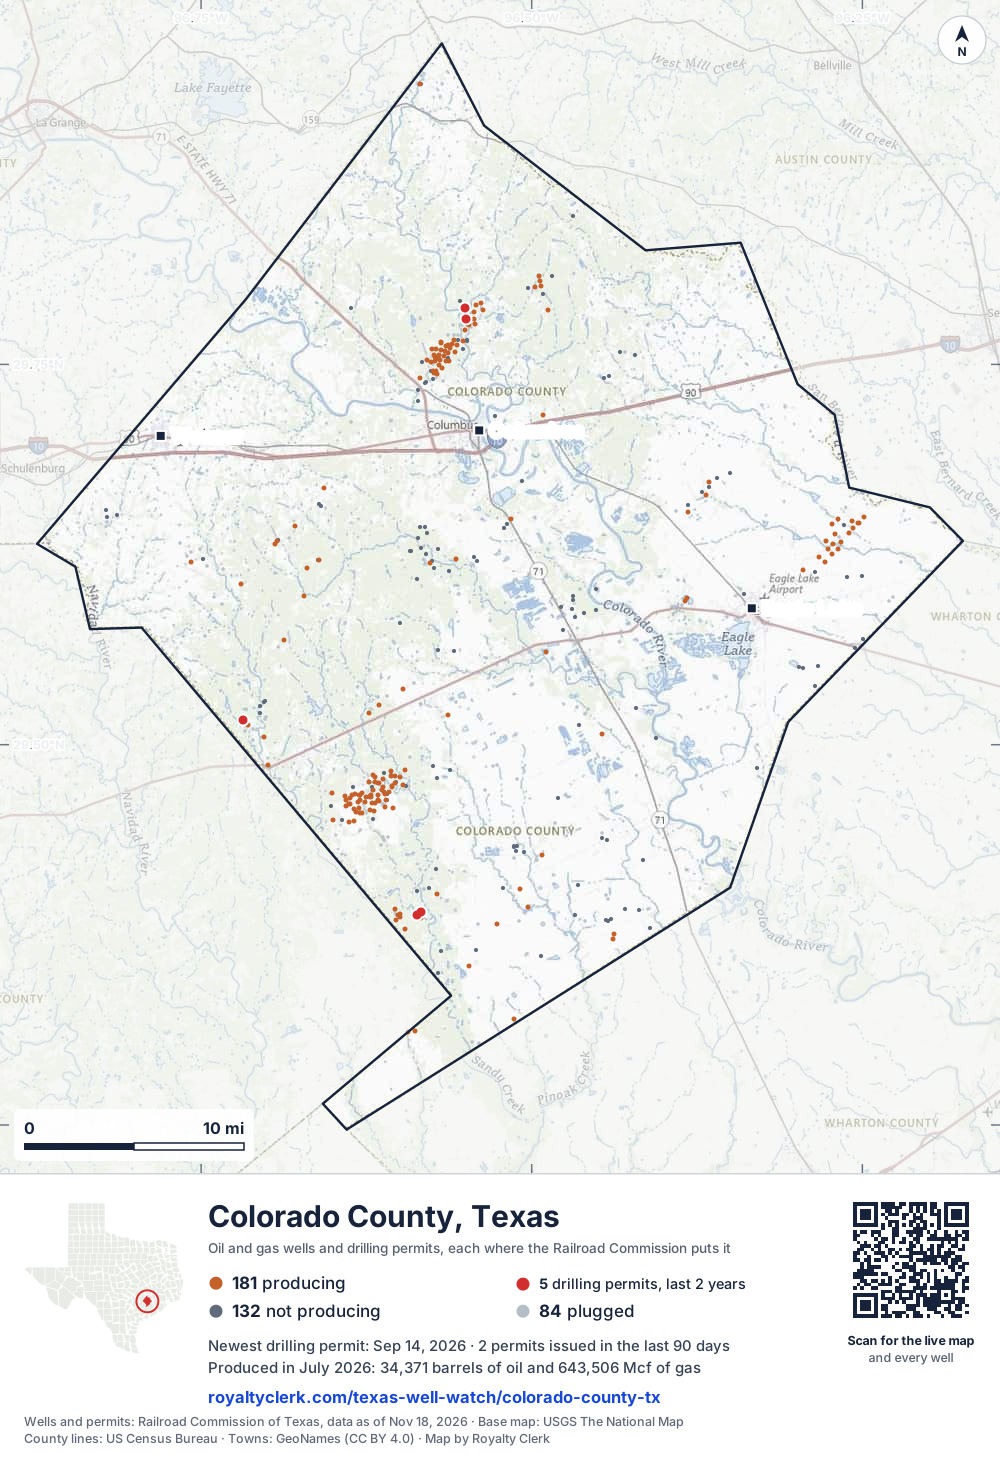
- Drilling locations5Permits issued in the last two years
- Producing wells181On a lease reporting production now
- Not producing133Shut in, inactive or no lease on record
- Plugged83The state's wellbore record says plugged
Sources: Railroad Commission of Texas well layers and permit files, US Census Bureau county outline, town points from GeoNames (CC BY 4.0), base map from USGS The National Map. A dot is a surface location; a horizontal well runs a mile or more from it.
397 wells with a location on the state's map (181 producing, 133 not producing, 83 plugged) and 5 drilling locations permitted in the last 24 months, each where the Railroad Commission puts it.
Use this map on your site
You may show this map on any site, unchanged. Keep the credit line and its link to Royalty Clerk under the map. The picture updates by itself as the state records new wells and permits.
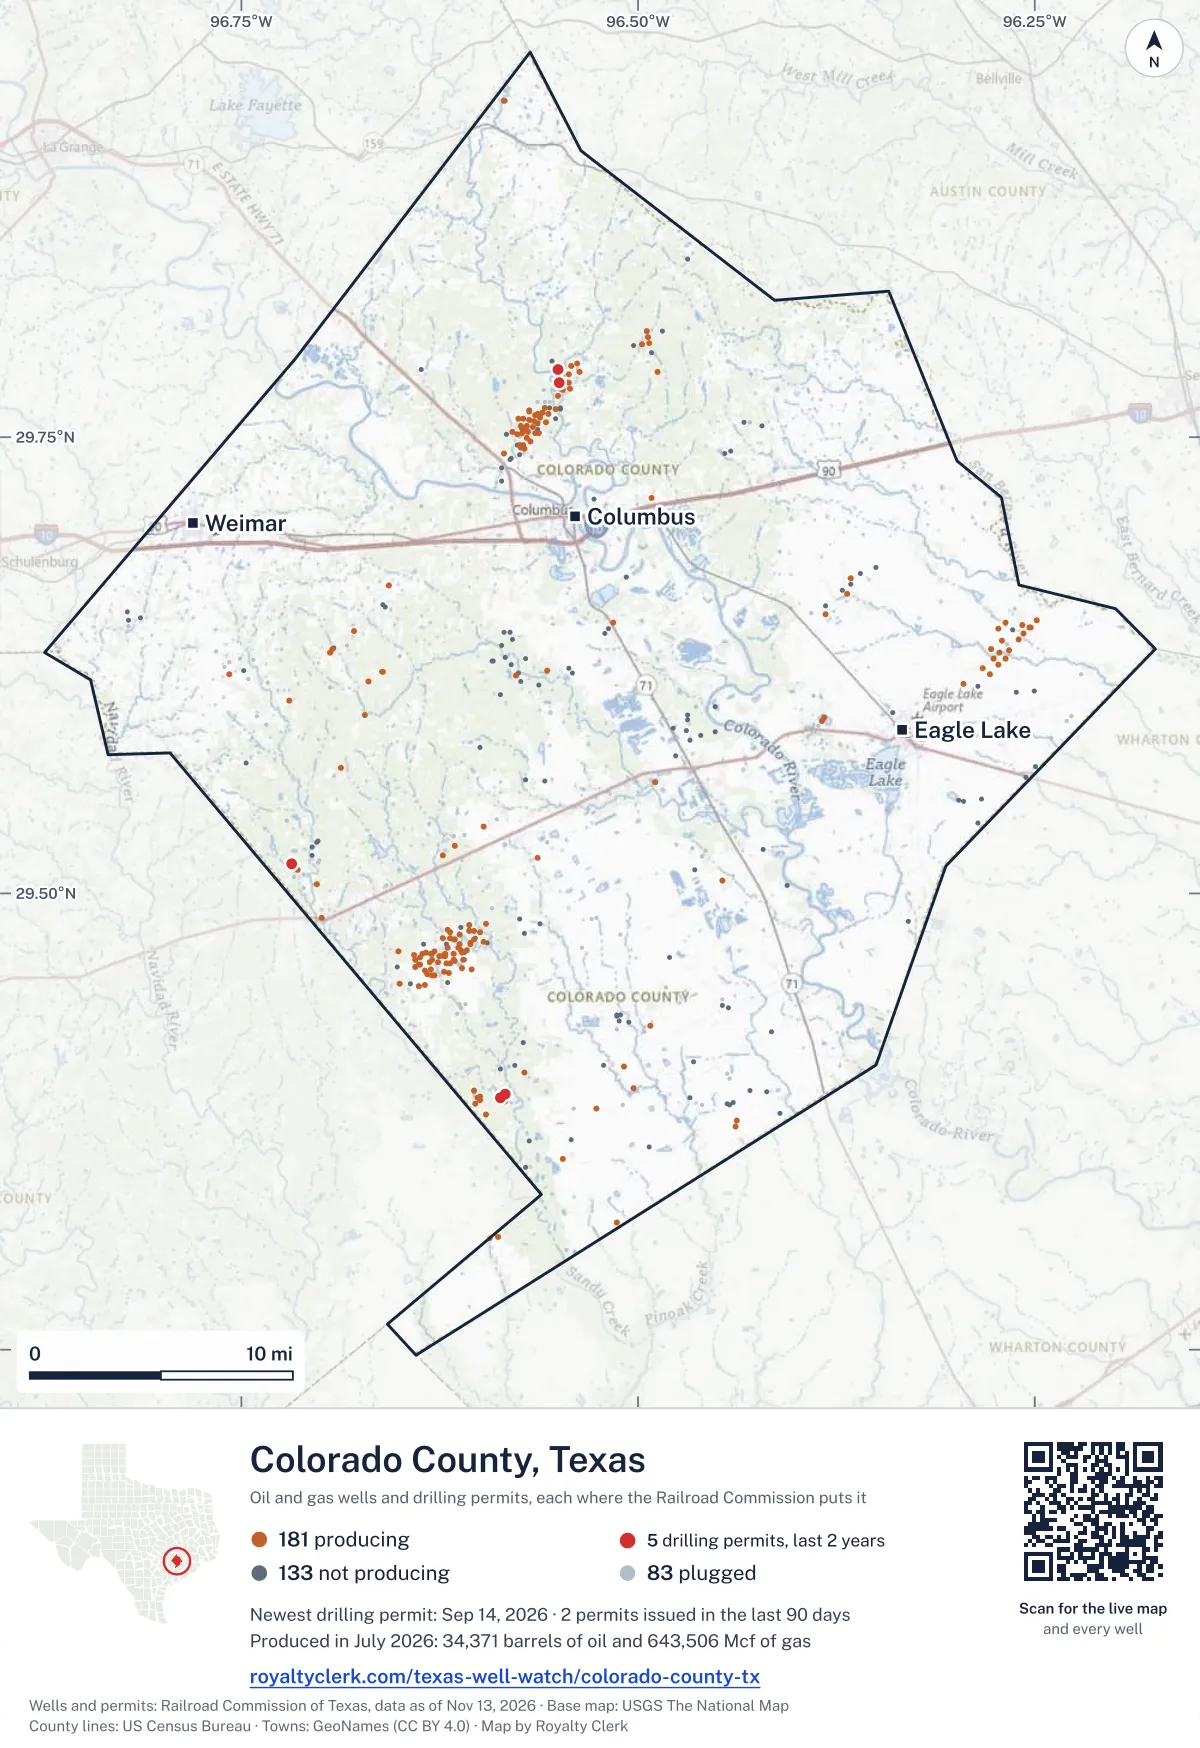
<a href="https://royaltyclerk.com/texas/counties/colorado-county-tx"><img src="https://royaltyclerk.com/maps/county-wells/colorado-county-tx.svg" alt="Map of Colorado County, Texas, with 397 oil and gas wells and 5 recent drilling locations as dots." width="1000" height="1457" loading="lazy" style="max-width:100%;height:auto;border:0"></a>
<p style="margin:4px 0 0;font-size:14px">Map: <a href="https://royaltyclerk.com/texas/counties/colorado-county-tx">Colorado County, Texas oil and gas wells</a> by Royalty Clerk, from Railroad Commission of Texas records</p>
Wells near a town: Columbus · Eagle Lake · Weimar · Newest drilling permits in Colorado County · Wells by ZIP code
Colorado County reported 6.5 million mcf of gas and 270,778 barrels of oil in the last 12 months. That ranks 86th of 197 Texas counties by gas.
County dossier
August 2026 is still coming in. About 89% of Texas leases have reported it so far, so this page counts through July 2026 until it is fully reported.
- Producing leases
- 152of 366 on record
- Operators
- 32
- Fields
- 47
- Top operator
- Remora Management, LLC
Own minerals in Colorado County?
A family member owned minerals here?
Search their name: a family member who owned minerals hereWhere it sits
This county
- Oil, last 12 months
- 270,778 bbl
- Share of Texas gas
- <0.1%
- Wells on record
- 397on leases with production reports
- Data through
- Jul 2026
If you own here
- Royalty calculator
Remora Management, LLC took over 74 leases in 2024. The tool turns volume, price and decimal into an estimated check, with costs and tax.
- Mineral interest finder
17 leases here list an estate, heirs or trust name. The search finds accounts and leases under a name.
- Find the land on my deed
Operators filed 4 permits in the last 12 months. The tool finds a section, block or abstract, with its wells and permits.
Questions owners ask
- Who runs the leases here now, and since when?
- Remora Management, LLC has led Colorado County since 2024, when it took over 74 leases from XTO Energy Inc. It reported 62 producing leases across the county. Remora's share is a little over a quarter of the county's oil and gas, counted in barrels of oil equivalent: 27.6%.
- How much has gas output changed since 1999?
- Gas was highest in 1999, at 45,035,389 mcf. In 2025 the county reported 6,606,900 mcf, from 282 leases. The mineral rights value tool uses the last year of income and a decline curve to estimate a value. Mineral rights value
- Who led the county before Remora?
- Hilcorp Energy Company led from 2000. Dominion Expl. & Prod., Inc. led from 2003, and XTO Energy Inc. led from 2007 until 2023. Hilcorp still reports leases here, and XTO has no leases left on record.
Related pages
- Remora Management, LLC
Leads the county: 74 leases taken over in 2024 and 27.6% of output.
- Tri-C Resources Partners I, LLC
Reports 19.8% of the county's output in barrels of oil equivalent.
- Strand Energy, L.C.
Filed 2 of the county's 4 recent drilling permits.
- Sheridan (Wilcox Consolidated)
Largest field here, with 62 producing leases now.
- Jamex, Inc.
Reports 27 leases here now; first reported in 1993.
From the state's records through July 2026.
How gas and oil moved over the last five years
Gas output in Colorado County fell 8% over the last 12 months
6.5M mcf through Jul 2026, against 7.1M mcf a year earlier. Peak Jul 2022: 1.2M mcf.
Oil output in Colorado County rose 3% over the last 12 months
271k bbl through Jul 2026, against 262k bbl a year earlier. Peak Jul 2022: 47.5k bbl.
SourceTexas Railroad Commission Production Data Query, county totals, through Jul 2026, file dated Oct 20, 2026.
Cite or embed this chart
Free to use for Colorado County, Texas, with a credit and a link. Copy what you need.
Credit line
Source: Royalty Clerk analysis of Texas Railroad Commission filings, https://royaltyclerk.com/texas/counties/colorado-county-tx, data to July 2026.
The chart on your own page
Free to embed on any site. Keep the “Source: Royalty Clerk” link under the chart.
See the code
<iframe
  src="https://royaltyclerk.com/embed/counties/colorado-county-tx"
  title="Royalty Clerk: oil and gas production, Colorado County, Texas"
  width="100%"
  height="400"
  style="border:0"
  loading="lazy"></iframe>
<p style="margin:4px 0 0;font-size:14px">Source: <a href="https://royaltyclerk.com/texas/counties/colorado-county-tx" target="_blank">Royalty Clerk</a></p>
<script>
window.addEventListener("message", function (e) {
  if (e.origin !== "https://royaltyclerk.com" || !e.data || e.data.type !== "rc-embed-height") return;
  var frames = document.getElementsByTagName("iframe");
  for (var i = 0; i < frames.length; i++) {
    if (frames[i].contentWindow === e.source && e.data.height > 0) frames[i].style.height = Number(e.data.height) + "px";
  }
});
</script>
Oil and gas by year back to January 1993
Every full year we hold, 1993 to 2025. The highest year for oil since 1993 was 1997, at 1,052,334 bbl. The highest year for gas was 1999, at 45,035,389 mcf.
| Year | Oilbbl | Gasmcf |
|---|---|---|
| 2025 | 248,457 | 6,606,900 |
| 2024 | 288,712 | 7,915,989 |
| 2023 | 377,594 | 10,291,310 |
| 2022 | 447,030 | 11,519,476 |
| 2021 | 448,008 | 10,063,308 |
| 2020 | 397,453 | 10,124,020 |
| 2019 | 552,310 | 15,493,392 |
| 2018 | 589,341 | 14,240,743 |
| 2017 | 534,591 | 14,576,263 |
| 2016 | 607,835 | 16,673,848 |
| 2015 | 835,955 | 21,116,763 |
| 2014 | 819,171 | 20,819,658 |
| 2013 | 493,814 | 14,207,329 |
| 2012 | 511,696 | 15,957,443 |
| 2011 | 483,880 | 18,079,865 |
| 2010 | 428,058 | 17,516,031 |
| 2009 | 452,809 | 20,271,498 |
| 2008 | 429,969 | 22,925,981 |
| 2007 | 453,954 | 27,146,064 |
| 2006 | 432,412 | 30,505,824 |
| 2005 | 409,888 | 23,352,533 |
| 2004 | 423,004 | 21,482,872 |
| 2003 | 448,042 | 22,789,439 |
| 2002 | 474,619 | 27,215,731 |
| 2001 | 545,070 | 26,918,914 |
| 2000 | 752,706 | 34,818,295 |
| 1999 | 843,673 | 45,035,389 |
| 1998 | 788,924 | 33,124,134 |
| 1997 | 1,052,334 | 40,479,593 |
| 1996 | 827,057 | 31,932,824 |
| 1995 | 726,280 | 27,335,114 |
| 1994 | 692,508 | 27,465,961 |
| 1993 | 687,930 | 28,726,945 |
SourceTexas Railroad Commission production records, added up by county and calendar year. Oil includes condensate; gas includes casinghead gas. The year in progress is left out until it is complete.
Which leases produce the most gas and oil now
Under each volume: change on the year before.
553,307mcf gas−4%
21,596bbl oil+4%
426,156mcf gasn/a
388,477mcf gas−2%
370,890mcf gas−3%
301,169mcf gas−18%
283,069mcf gas+16%
243,498mcf gas+1%
8,941bbl oiln/a
208,443mcf gas−28%
200,597mcf gas−24%
8,156bbl oil−3%
176,633mcf gas−9%
6,844bbl oil+6%
6,577bbl oil+6%
136,667mcf gas+57%
5,146bbl oil−1%
113,664mcf gas+110%
4,340bbl oil−9%
4,190bbl oil+11%
97,673mcf gas+112%
97,650mcf gasn/a
92,619mcf gas−3%
91,953mcf gas+151%
81,707mcf gas−21%
Showing 25 of 150 (the 150 largest of 152), ranked by output value.
SourceTexas Railroad Commission Production Data Query.
Who runs the leases, and what they produce
Operators in Colorado County, by gas
Which operators produce the most here now
Fields in Colorado County, by gas
Which fields produce the most here now
- Sheridan (Wilcox Consolidated)62 leases · District 03 · Field 831073752Mmcf
- Paul (LW-75)4 leases · District 03 · Field 697405001.4Mmcf
- Columbus (Consolidated)17 leases · District 03 · Field 19837005760kmcf
- Columbus (Midway 12100)1 lease · District 03 · Field 19837121426kmcf
- Glasscock (Wilcox 11,200)3 leases · District 03 · Field 35231960413kmcf
- Chesterville, N. (Pack)16 leases · District 03 · Field 17552095394kmcf
- Giddings (Austin Chalk, Gas)1 lease · District 03 · Field 34773550301kmcf
- Sublime (8950)1 lease · District 03 · Field 86862800201kmcf
More operators here
Where new drilling permits have been filed lately
BETH OFFUTT #1
recompletion · Shiner Exploration, LLC · Colorado County
Permit 0918564 · Sep 14, 2026
CULLEN, H. R. ET AL #14
new drill · Strand Energy, L.c. · Colorado County
Permit 0918180 · Aug 31, 2026
HASTEDT 'A' #6
new drill · Strand Energy, L.c. · Colorado County
Permit 0910662 · Sep 24, 2025
BALUSEK WOOTTON #1
recompletion · B D Production Co., Inc. · Colorado County
Permit 0909623 · Aug 5, 2025
BALUSEK-WOOTTON UNIT #2
new drill · B D Production Co., Inc. · Colorado County
Permit 0907448 · Apr 22, 2025
DURBIN GAS UNIT #1
reclass · Shiner Exploration, LLC · Colorado County
Permit 0903772 · Nov 4, 2024