
Texas county · RRC district 03
Lee County, Texas oil and gas
- 5,871,511bbl oil in the last 12 months
- 497producing leases
- 1,084wells on the map
- 34drilling locations in two years
Oil wells and drilling locations in Lee County
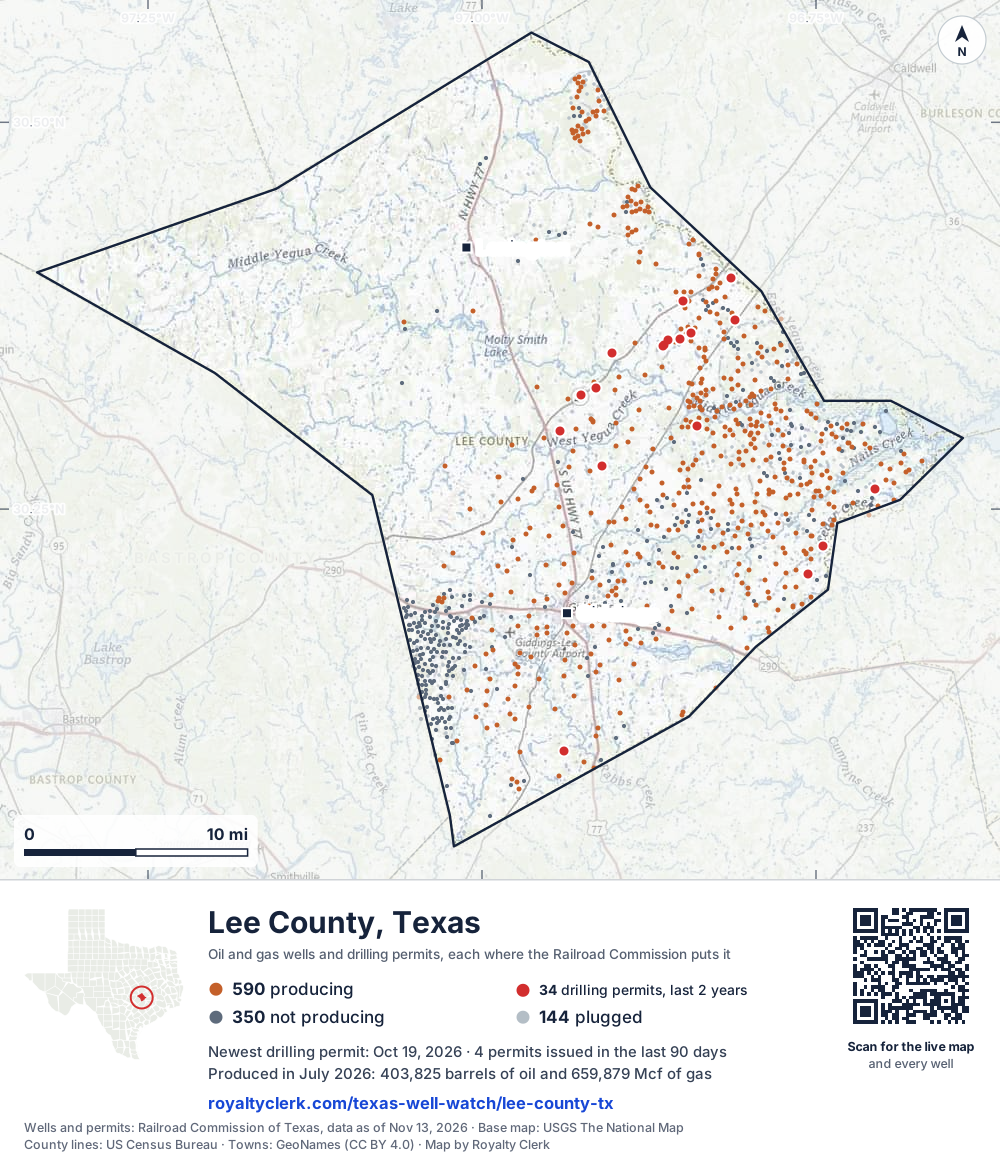
- Drilling locations34Permits issued in the last two years
- Producing wells590On a lease reporting production now
- Not producing350Shut in, inactive or no lease on record
- Plugged144The state's wellbore record says plugged
Sources: Railroad Commission of Texas well layers and permit files, US Census Bureau county outline, town points from GeoNames (CC BY 4.0), base map from USGS The National Map. A dot is a surface location; a horizontal well runs a mile or more from it.
1,084 wells with a location on the state's map (590 producing, 350 not producing, 144 plugged) and 34 drilling locations permitted in the last 24 months, each where the Railroad Commission puts it.
Use this map on your site
You may show this map on any site, unchanged. Keep the credit line and its link to Royalty Clerk under the map. The picture updates by itself as the state records new wells and permits.
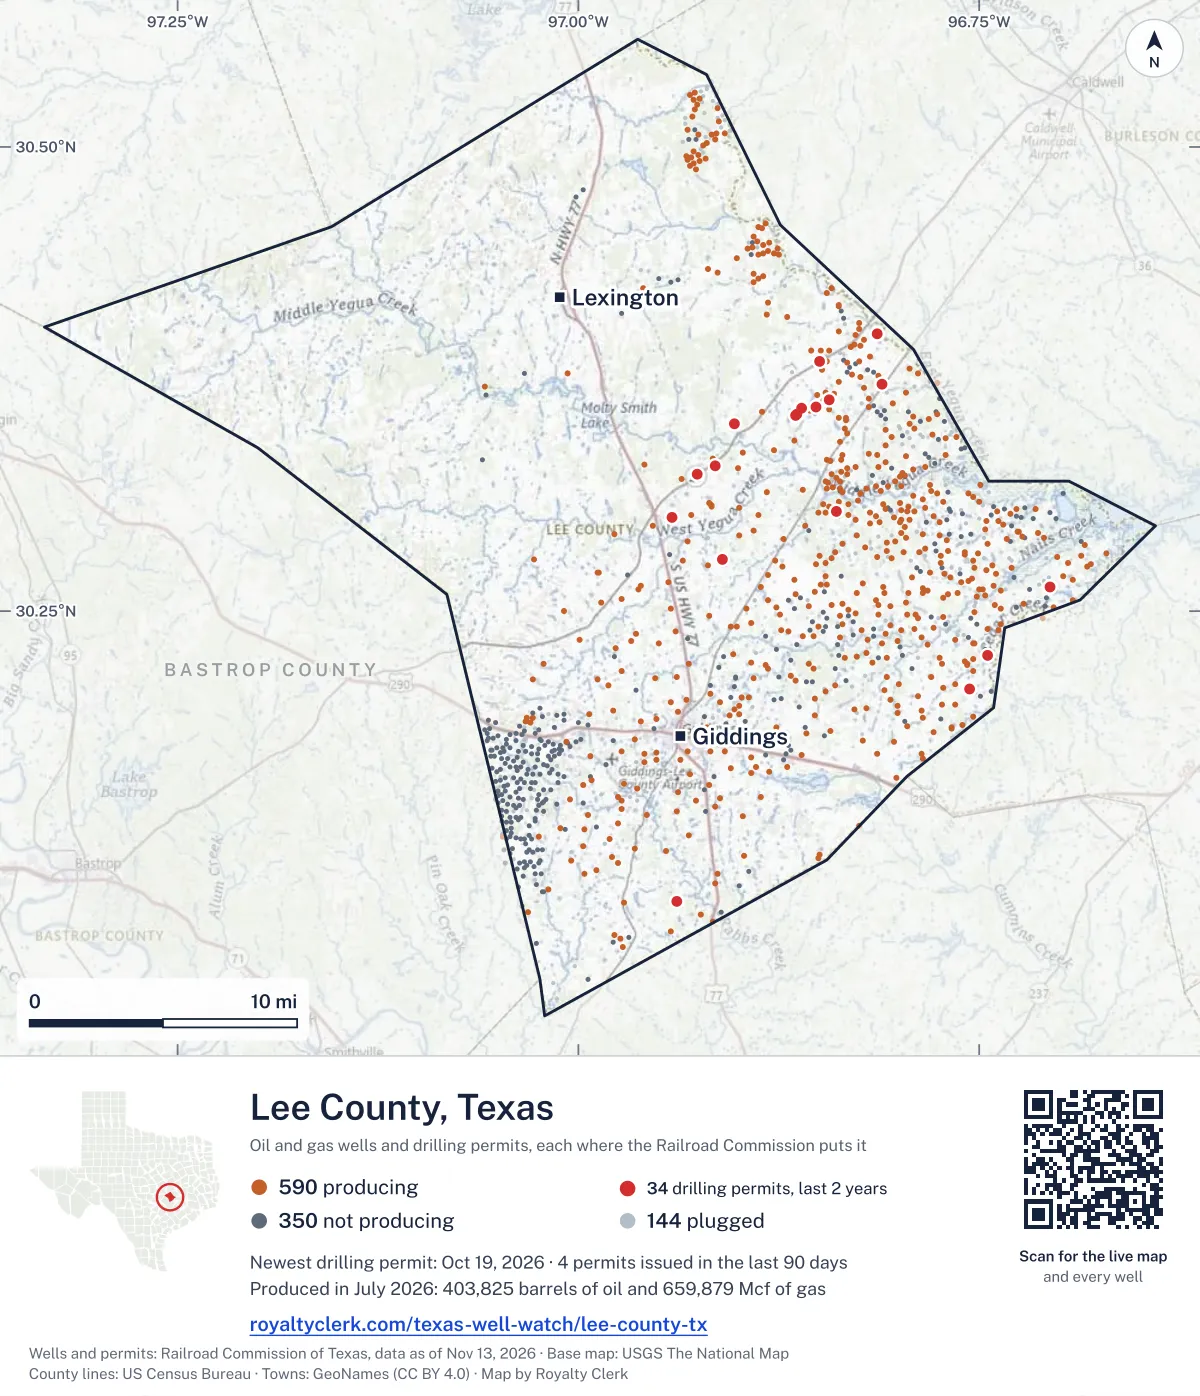
<a href="https://royaltyclerk.com/texas/counties/lee-county-tx"><img src="https://royaltyclerk.com/maps/county-wells/lee-county-tx.svg" alt="Map of Lee County, Texas, with 1,084 oil and gas wells and 34 recent drilling locations as dots." width="1000" height="1163" loading="lazy" style="max-width:100%;height:auto;border:0"></a>
<p style="margin:4px 0 0;font-size:14px">Map: <a href="https://royaltyclerk.com/texas/counties/lee-county-tx">Lee County, Texas oil and gas wells</a> by Royalty Clerk, from Railroad Commission of Texas records</p>
Wells near a town: Giddings · Lexington · Newest drilling permits in Lee County · Wells by ZIP code
Lee County is one of the 27 counties of the Eagle Ford Shale
Lee County reported 5.9 million barrels of oil and 9.2 million mcf of gas in the last 12 months. That ranks 37th of 225 Texas counties by oil.
County dossier
August 2026 is still coming in. About 89% of Texas leases have reported it so far, so this page counts through July 2026 until it is fully reported.
- Producing leases
- 497of 938 on record
- Operators
- 26
- Fields
- 17
- Top operator
- Sage Natural Resources LLC
Own minerals in Lee County?
A family member owned minerals here?
Search their name: a family member who owned minerals hereWhere it sits
This county
- Gas, last 12 months
- 9,245,217 mcf
- Share of Texas oil
- 0.3%
- Wells on record
- 1,086on leases with production reports
- Data through
- Jul 2026
Five years of output in Lee County
Oil output in Lee County held steady over the last 12 months
5.9M bbl through Jul 2026, against 5.8M bbl a year earlier. Peak Mar 2025: 591k bbl.
Gas output in Lee County fell 5% over the last 12 months
9.2M mcf through Jul 2026, against 9.7M mcf a year earlier. Peak Mar 2025: 926k mcf.
SourceTexas Railroad Commission Production Data Query, county totals, through Jul 2026, file dated Oct 20, 2026.
Cite or embed this chart
Free to use for Lee County, Texas, with a credit and a link. Copy what you need.
Credit line
Source: Royalty Clerk analysis of Texas Railroad Commission filings, https://royaltyclerk.com/texas/counties/lee-county-tx, data to July 2026.
The chart on your own page
Free to embed on any site. Keep the “Source: Royalty Clerk” link under the chart.
See the code
<iframe
  src="https://royaltyclerk.com/embed/counties/lee-county-tx"
  title="Royalty Clerk: oil and gas production, Lee County, Texas"
  width="100%"
  height="400"
  style="border:0"
  loading="lazy"></iframe>
<p style="margin:4px 0 0;font-size:14px">Source: <a href="https://royaltyclerk.com/texas/counties/lee-county-tx" target="_blank">Royalty Clerk</a></p>
<script>
window.addEventListener("message", function (e) {
  if (e.origin !== "https://royaltyclerk.com" || !e.data || e.data.type !== "rc-embed-height") return;
  var frames = document.getElementsByTagName("iframe");
  for (var i = 0; i < frames.length; i++) {
    if (frames[i].contentWindow === e.source && e.data.height > 0) frames[i].style.height = Number(e.data.height) + "px";
  }
});
</script>
Lee County oil and gas production by year, 1993 to 2025
Every full year we hold, 1993 to 2025. The highest year for oil since 1993 was 1994, at 7,529,926 bbl. The highest year for gas was 1995, at 30,377,743 mcf.
| Year | Oilbbl | Gasmcf |
|---|---|---|
| 2025 | 6,316,182 | 9,794,921 |
| 2024 | 4,497,210 | 8,723,327 |
| 2023 | 2,687,046 | 7,495,360 |
| 2022 | 2,555,391 | 7,086,572 |
| 2021 | 2,400,222 | 5,569,935 |
| 2020 | 2,506,004 | 5,218,641 |
| 2019 | 2,360,995 | 4,688,688 |
| 2018 | 2,293,573 | 4,674,029 |
| 2017 | 1,159,198 | 4,926,789 |
| 2016 | 1,502,188 | 5,721,739 |
| 2015 | 1,879,680 | 7,113,184 |
| 2014 | 1,904,240 | 8,177,760 |
| 2013 | 1,188,588 | 7,437,062 |
| 2012 | 1,239,734 | 8,141,560 |
| 2011 | 1,053,104 | 8,357,601 |
| 2010 | 1,096,170 | 8,917,938 |
| 2009 | 1,147,279 | 10,021,902 |
| 2008 | 1,164,731 | 10,888,255 |
| 2007 | 1,184,759 | 12,095,984 |
| 2006 | 1,451,950 | 14,979,577 |
| 2005 | 1,687,169 | 14,495,942 |
| 2004 | 1,535,661 | 13,872,569 |
| 2003 | 1,694,676 | 15,673,108 |
| 2002 | 1,844,065 | 17,306,719 |
| 2001 | 2,041,847 | 20,683,790 |
| 2000 | 2,204,993 | 22,527,056 |
| 1999 | 2,253,682 | 23,723,719 |
| 1998 | 2,907,273 | 22,312,516 |
| 1997 | 3,527,085 | 27,829,810 |
| 1996 | 4,240,880 | 29,637,966 |
| 1995 | 5,748,821 | 30,377,743 |
| 1994 | 7,529,926 | 28,857,542 |
| 1993 | 5,865,893 | 18,705,408 |
SourceTexas Railroad Commission production records, added up by county and calendar year. Oil includes condensate; gas includes casinghead gas. The year in progress is left out until it is complete.
The biggest leases in Lee County
Under each volume: change on the year before.
416,425bbl oiln/a
384,697bbl oiln/a
258,874bbl oiln/a
241,523bbl oil−39%
- DOBBS EF
215,690bbl oiln/a
186,057bbl oiln/a
185,875bbl oiln/a
180,633bbl oiln/a
172,425bbl oil+18%
170,389bbl oiln/a
148,128bbl oiln/a
- WOODROW EF SOUTH UNIT
136,432bbl oiln/a
132,221bbl oil−50%
108,388bbl oil−39%
107,286bbl oil−56%
101,398bbl oil+130%
93,557bbl oil+25%
93,036bbl oiln/a
90,186bbl oil−39%
- BLUE DUCK EF WEST
83,385bbl oiln/a
76,927bbl oil−37%
71,672bbl oil−39%
- BLUE DUCK EF EAST
65,313bbl oiln/a
63,267bbl oil−60%
62,630bbl oil−48%
Showing 25 of 150 (the 150 largest of 497), ranked by output value.
SourceTexas Railroad Commission Production Data Query.
Who runs the leases, and what they produce
Operators in Lee County, by oil
Sage Natural Resources leads
- Sage Natural Resources LLC15 leases2.3Mbbl
- Magnolia Oil & Gas Operating LLC281 leases1.9Mbbl
- EOG Resources, Inc.38 leases1Mbbl
- Wildfire Energy Operating LLC17 leases155kbbl
- Paleo Oil Company LLC9 leases120kbbl
- Ironbloom Operating, LLC6 leases95kbbl
- Leexus Oil LLC16 leases35.2kbbl
- Atlas Operating LLC15 leases19.3kbbl
Fields in Lee County, by oil
Giddings (Eagleford) leads
- Giddings (Eagleford)29 leases · District 03 · Field 347336102.4Mbbl
- Giddings (Austin Chalk-3)317 leases · District 03 · Field 347335002.1Mbbl
- Southern Bay (Eagle Ford)40 leases · District 03 · Field 847505001.1Mbbl
- Hooker Creek (Navarro A)47 leases · District 03 · Field 4249350014.4kbbl
- Giddings (Navarro, Oil)14 leases · District 03 · Field 347336245,906bbl
- Serbin (Taylor Sand)7 leases · District 03 · Field 822655005,214bbl
- Giddings (Austin Chalk, Gas)6 leases · District 03 · Field 347735503,800bbl
- Noack Cow Herd (3460)6 leases · District 03 · Field 656075002,474bbl
More operators here
Recent drilling permits in Lee County
PEDRO EAST EF #1H
new drill · horizontal · Sage Natural Resources LLC · Lee County
Permit 0919028 · Oct 19, 2026
PEDRO WEST EF #1H
new drill · horizontal · Sage Natural Resources LLC · Lee County
Permit 0919039 · Oct 5, 2026
LAGUNA A #1HE
new drill · horizontal · Wildfire Energy Operating LLC · Lee County
Permit 0917913 · Sep 10, 2026
LAGUNA B #2HE
new drill · horizontal · Wildfire Energy Operating LLC · Lee County
Permit 0917927 · Aug 21, 2026
NELDA #1H
recompletion · horizontal · Ironbloom Operating, LLC · Lee County
Permit 0917170 · Jul 16, 2026
BUCK TRAVIS TWO #H 02BT
new drill · horizontal · Magnolia Oil & Gas Operating LLC · Lee County
Permit 0916801 · Jul 8, 2026