
Texas countyRailroad Commission district 01Through July 2026
La Salle CountyTexas oil and gas
La Salle County sold 46.8 million barrels of oil and 366 billion cubic feet of gas in the last 12 months. Gas passed oil here in 2021.
August 2026 is still coming in. About 89% of Texas leases have reported it so far, so this page counts through July 2026 until it is fully reported.
- Oil, last 12 months
- 46.8 million bbl
- Gas, last 12 months
- 366 billion cu ft
- Producing leases
- 2,927 of 3,508
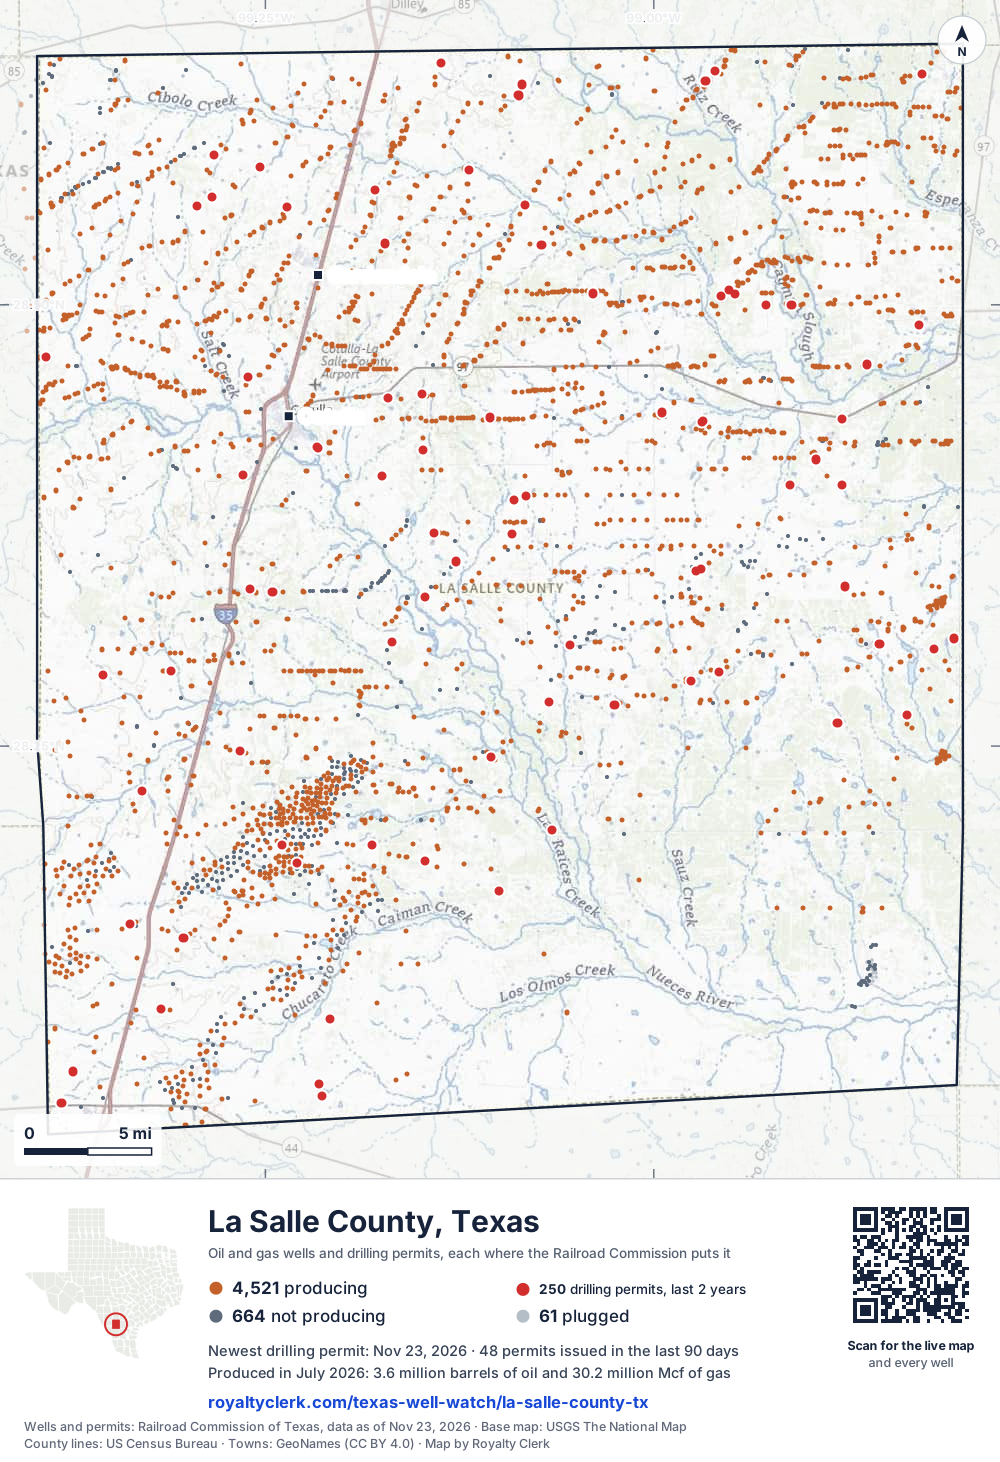
- Wells on the map
- 5,246
- Drilling locations, two years
- 243
- Wells on record
- 5,253
- Operators
- 33
- Top field
- Eagleville (Eagle Ford-1)
The story, from 403 months of reports
How La Salle County turned from oil to gas
- 1Gas county JANUARY 1993
- 2Oil passes gas MARCH 2012
- 3Most new wells DECEMBER 2014
- 4Gas passes oil JUNE 2021
La Salle County turned from oil to gas in 2021, ending a run of oil years from 2012 to 2020. Gas had made more of its output in the years from 1993 to 2011. The full calendar year that produced the most oil was 2015, at 81,606,820 barrels.
Lewis Petro Properties, Inc. has led the county's leases since 1995 and reports 609 of them now. Verdun Oil Ef II LLC took 432 leases from Ep Energy E&P Company, LLC in 2025, and Ineos USA Oil & Gas LLC took 339 from Chesapeake Operating, L.L.C. in 2023.
Drilling has grown fast in recent years. The permit file shows 99 permits in 2023 and 175 in 2024. In the last 12 months, 159 permits were filed, all for horizontal wells. Gas in the last 12 months, 365,943,581 mcf, is above 2025, the full calendar year that produced the most gas at 350,951,071 mcf.
- 1995 Lewis Petro Properties, Inc. takes the lead with 36 leases.
- 2012 Oil made more of the county's output than gas, 2012 to 2020.
- 2015 Oil reaches its biggest full calendar year: 81,606,820 barrels.
- 2021 Gas makes more of the output than oil; the county turns to gas.
- 2023 Ineos USA Oil & Gas LLC takes 339 leases from Chesapeake Operating, L.L.C.
- 2025 Verdun Oil Ef II LLC takes 432 leases from Ep Energy E&P Company, LLC.
State records through July 2026.
Not a forecast, not reserves.
219 producing counties, biggest first
14th in Texas for oil, 12th for gas
Each line is one Texas county, drawn to what it sold in the last 12 months. La Salle County is the blue one. In 1993 it was 109th for oil and 106th for gas.
of all Texas oil in the last 12 months.
of all Texas gas.
operators. The biggest is EOG Resources, Inc..
fields. The biggest is Eagleville (Eagle Ford-1).
SourceTexas Railroad Commission Production Data Query, every county, August 2025 to July 2026.
For mineral owners, from the state record
What La Salle County owners ask
- 01Who pays royalties in La Salle County?
- Verdun Oil Ef II LLC475Lewis Petro Properties, Inc.448EOG Resources, Inc.425
- 33 operators run the county's producing leases. The one that pays you is the company named on your check stub. Verdun Oil Ef II LLC runs the most leases, 475 of the 2,927.
- Source: Railroad Commission production reports, operator of record.
- Find the operator of your lease
- 02If oil or gas sold in July 2026, when would a regular check be due?
- Jul 31sale month endsSep 29oil dueOct 29gas due
- For a subsequent sale in July 2026, the usual Texas deadlines would be September 29, 2026 for oil and October 29, 2026 for gas. These are 60 and 90 days after month-end when the written agreement sets no payment schedule. First sales follow a different rule.
- Source: Railroad Commission production reports; Texas Natural Resources Code §91.402.
- See your next three checks
- 03Is my family's name on the La Salle County mineral roll?
- Royalty interests76,898In an estate's name489
- The appraisal district's 2026 roll lists 76,898 royalty-interest records. At least 489 of them (0.64%) are still in the name of an estate. Search a family name to see whether an account is there.
- Source: La Salle County Appraisal District, 2026 mineral roll. No owner is named on this page.
- Search a family name
- 04Why did my La Salle County check go down?
- Oil sold▼ 10.1%Oil price▲ 6.53%Gas sold▲ 13.8%Gas price▲ 17.5%
- Across the county, oil sold is down 10.1% on the 12 months before and the oil price is up 6.53%. In the same months gas sold is up 13.8% and the gas price up 17.5%. A check can move with the county's volume and the price with nothing wrong on the lease. The statement check tells the two apart.
- Source: Railroad Commission production reports; U.S. Energy Information Administration prices.
- Why is my check lower?
- 05Why did the county turn from oil to gas in 2021?
- Gas has made more of the county's output than oil in every full calendar year since 2021. In the last 12 months gas made 56.6% of the output, counted in barrels of oil equivalent. Lease handovers happened in the same years, including 432 leases in 2025.
- 06Who reports the most leases here now?
- Lewis Petro Properties, Inc. reports the most leases now, 609. Verdun Oil Ef II LLC reports 491 and EOG Resources, Inc. reports 439. The 3 biggest operators reported 45.5% of the county's output in the last 12 months, counted in barrels of oil equivalent.
- 07How many drilling permits have been filed here recently?
- The permit file shows 99 permits in 2023, 175 in 2024 and 111 in 2025. In the last 12 months, 16 operators filed 159 permits, all for horizontal wells.
- Find the land on my deed
403 months against seven other recordsNew
Every month since January 1993, and what else happened that month
The whole county is the line on top. Under it, on the same clock: the weather, the price, how many leases reported, new wells, takeovers, State cut-offs and leases that went silent. Move across it.
Oil averaged $64.51 a barrel · 2,626 leases reporting
- WeatherCold, February 1, 2026.
- Operators1 lease changed operator this month.
- StateThe State cut off 3 leases' right to sell this month. The most common reason on file: Delinquent H-15 (inactive well test).
- Leases2,626 leases reported, 211 fewer than the month before.
- Reports318 leases reported nothing this month, inside a run of silent months.
Move the pointer or drag across the chart. The numbered buttons jump to each month.
Monthly production of the whole county with seven aligned record tracks beneath it. Use the left and right arrow keys to move month by month.. 403 months from January 1993 to July 2026. The most in one month: 7.76 million barrels, March 2015. The newest month: 3.59 million barrels. Moments marked: 1, Sep 2001; 2, Feb 2021; 3, Feb 2022; 4, Jan 2024; 5, Jan 2026; 6, Feb 2026.
SourcesProduction, leases, new wells, takeovers, cut-offs and silent leases: Railroad Commission of Texas, reported through July 2026. Weather: NOAA storm reports, record dated October 26, 2026. Prices: U.S. Energy Information Administration, through October 2026. An empty lane means nothing of that kind on the records read. A record in the same month is not proof of a cause.
Royalty Watch tells you the month your own lease starts to drop, with the records from that month.See Royalty Watch
34 years of state records, 1993 to 2026
How oil and gas changed year by year
$69.1billion
What the county's oil and gas sold for at each month's public prices, before tax and the operators' deductions.
- Oil sold
- 806 millionbarrels
- Gas sold
- 4.27 trillioncubic feet
- Sold the most
- 2014$8.0 billion sold
| Year | Oil, dollars | Gas, dollars | Total |
|---|---|---|---|
| 1993 | $17.7 million | $20.8 million | $38.5 million |
| 1994 | $11.9 million | $17.8 million | $29.7 million |
| 1995 | $8.3 million | $14 million | $22.4 million |
| 1996 | $9.2 million | $21.4 million | $30.6 million |
| 1997 | $7.3 million | $24.6 million | $32 million |
| 1998 | $3.8 million | $18.9 million | $22.8 million |
| 1999 | $4.7 million | $18.6 million | $23.3 million |
| 2000 | $8.7 million | $38.3 million | $47 million |
| 2001 | $7.1 million | $36.5 million | $43.6 million |
| 2002 | $6.9 million | $37 million | $43.9 million |
| 2003 | $8.8 million | $68 million | $76.8 million |
| 2004 | $10.6 million | $73.1 million | $83.7 million |
| 2005 | $17.1 million | $127.9 million | $145.1 million |
| 2006 | $22.1 million | $102.1 million | $124.2 million |
| 2007 | $23.9 million | $105.3 million | $129.3 million |
| 2008 | $31 million | $130.6 million | $161.7 million |
| 2009 | $26 million | $94.1 million | $120.2 million |
| 2010 | $111.6 million | $178 million | $289.7 million |
| 2011 | $720.1 million | $270 million | $990.1 million |
| 2012 | $2.3 billion | $354.3 million | $2.7 billion |
| 2013 | $5.1 billion | $773.3 million | $5.9 billion |
| 2014 | $7.0 billion | $1.0 billion | $8.0 billion, sold the most |
| 2015 | $3.9 billion | $686.4 million | $4.6 billion |
| 2016 | $2.4 billion | $570.2 million | $2.9 billion |
| 2017 | $2.8 billion | $629.3 million | $3.4 billion |
| 2018 | $4.2 billion | $795.1 million | $5.0 billion |
| 2019 | $3.7 billion | $722.7 million | $4.4 billion |
| 2020 | $2.0 billion | $564.1 million | $2.6 billion |
| 2021 | $3.1 billion | $1.1 billion | $4.2 billion |
| 2022 | $3.7 billion | $2.0 billion | $5.8 billion |
| 2023 | $3.5 billion | $875.5 million | $4.4 billion |
| 2024 | $3.7 billion | $734.7 million | $4.4 billion |
| 2025 | $3.4 billion | $1.2 billion | $4.6 billion |
| 2026, to July | $2.2 billion | $796.8 million | $3.0 billion |
For research and teaching
Source: Royalty Clerk analysis of Texas Railroad Commission filings, https://royaltyclerk.com/texas/counties/la-salle-county-tx, data to July 2026.
La Salle County oil and gas by year, 1993 to 2026
| Year | Oilbbl | Gasmcf | Sold forat that month's prices |
|---|---|---|---|
| 2026, to July | 26,357,417 | 210,965,593 | $3.0 billion |
| 2025 | 52,335,667 | 350,951,071 | $4.6 billion |
| 2024 | 48,937,084 | 336,477,397 | $4.4 billion |
| 2023 | 46,346,228 | 347,034,967 | $4.4 billion |
| 2022 | 39,699,727 | 318,147,197 | $5.8 billion |
| 2021 | 45,688,283 | 302,138,313 | $4.2 billion |
| 2020 | 52,635,776 | 277,465,506 | $2.6 billion |
| 2019 | 65,523,238 | 283,758,089 | $4.4 billion |
| 2018 | 65,219,381 | 250,337,733 | $5.0 billion |
| 2017 | 55,999,068 | 210,915,934 | $3.4 billion |
| 2016 | 56,682,336 | 229,353,945 | $2.9 billion |
| 2015 | 81,606,820 | 261,424,496 | $4.6 billion |
| 2014 | 75,869,974 | 242,217,432 | $8.0 billion |
| 2013 | 52,230,983 | 206,710,848 | $5.9 billion |
| 2012 | 25,877,298 | 126,111,077 | $2.7 billion |
| 2011 | 7,667,113 | 69,054,859 | $990.1 million |
| 2010 | 1,365,646 | 40,749,286 | $289.7 million |
| 2009 | 396,183 | 23,832,280 | $120.2 million |
| 2008 | 315,078 | 14,788,167 | $161.7 million |
| 2007 | 330,374 | 15,122,549 | $129.3 million |
| 2006 | 334,351 | 15,138,907 | $124.2 million |
| 2005 | 302,122 | 14,260,987 | $145.1 million |
| 2004 | 255,089 | 12,397,662 | $83.7 million |
| 2003 | 282,254 | 12,439,977 | $76.8 million |
| 2002 | 268,366 | 10,862,230 | $43.9 million |
| 2001 | 273,478 | 9,371,434 | $43.6 million |
| 2000 | 287,993 | 8,859,373 | $47 million |
| 1999 | 242,818 | 8,192,029 | $23.3 million |
| 1998 | 266,865 | 9,025,418 | $22.8 million |
| 1997 | 357,196 | 9,840,836 | $32 million |
| 1996 | 419,449 | 9,352,864 | $30.6 million |
| 1995 | 453,818 | 8,715,242 | $22.4 million |
| 1994 | 694,267 | 9,440,645 | $29.7 million |
| 1993 | 951,921 | 9,965,227 | $38.5 million |
SourcesRailroad Commission Production Data Query, every monthly report since January 1993. EIA monthly WTI and Henry Hub prices, and the Texas wellhead gas price before 1997. 2026 is part of a year, drawn lighter. Not a forecast, not reserves.
La Salle County Appraisal District, 2026 mineral roll
What the county appraisal roll shows
- Records
- 76,898
- In an estate's name
- 489at least
- Share
- 0.64%
Is one of these yours?
Each square is 500 records
- Royalty interests 76,898
- In an estate's name 489
SourceRoyalty Clerk count of the La Salle County mineral appraisal roll of 2026, read November 2026. A record is one line of the roll, not one person. No owner is named on this page. Every county, with the method.
2,927 producing leases
How many leases report here now
Most oil leases here are small. The bars count the county's oil leases by how much oil each sold in the last 12 months. Find your lease and its bar turns blue.
Search, sort and filter the 150 biggest leases
Under each volume: change on the year before.
877,114bbl oil−36%
826,048bbl oil−40%
633,419bbl oil−11%
508,741bbl oil+83%
457,157bbl oil−11%
447,151bbl oil−23%
381,044bbl oil−15%
348,455bbl oil−13%
347,397bbl oiln/a
296,368bbl oil−26%
278,321bbl oil+4%
277,137bbl oiln/a
263,682bbl oiln/a
250,745bbl oil−11%
243,312bbl oil−64%
230,649bbl oiln/a
5,316,640mcf gasn/a
5,152,497mcf gasn/a
215,825bbl oiln/a
4,948,234mcf gasn/a
207,721bbl oiln/a
4,747,144mcf gasn/a
201,159bbl oil−2%
194,323bbl oiln/a
4,479,763mcf gasn/a
Showing 25 of 150 (the 150 largest of 2,927), ranked by output value.
SourceTexas Railroad Commission Production Data Query, through July 2026. 581 more leases are on record and not producing.
33 operators, 32 fields
Who runs the leases, and what they produce
Which operators produce the most here now
- 1EOG Resources, Inc.12,471,381bbl425 leases · 26.6% of the county's oil
- 2Verdun Oil Ef II LLC9,007,035bbl475 leases · 19.2% of the county's oil
- 3Javelin Energy Partners Mgmt LLC6,531,170bbl292 leases · 13.9% of the county's oil
- 4Ineos USA Oil & Gas LLC4,195,827bbl354 leases · 8.96% of the county's oil
- 5Verdun Oil & Gas LLC3,582,440bbl183 leases · 7.65% of the county's oil
- 6XTO Energy Inc.2,897,722bbl32 leases · 6.19% of the county's oil
Which fields produce the most now
- 1Eagleville (Eagle Ford-1)38,652,428bbl1,764 leases · 82.5% of the county's oil · District 01 · Field 27135700
- 2Hawkville (Eagleford Shale)5,389,737bbl647 leases · 11.5% of the county's oil · District 01 · Field 39744500
- 3Briscoe Ranch (Eagleford)1,888,240bbl118 leases · 4.03% of the county's oil · District 01 · Field 12018200
- 4A.w.p. (Olmos)146,002bbl19 leases · 0.31% of the county's oil · District 01 · Field 00256500
- 5Pearsall (Austin Chalk)66,316bbl11 leases · 0.14% of the county's oil · District 01 · Field 69981125
- 6Lorenzo (Austin Chalk)58,145bbl3 leases · 0.12% of the county's oil · District 01 · Field 54928500
- 7Tres Encanto (Escondido)39,485bbl12 leases · 0.08% of the county's oil · District 01 · Field 91058080
- 8Sun T S H (Olmos)9,866bbl169 leases · 0.02% of the county's oil · District 01 · Field 87251500
- 9Atlee (Olmos)397bbl46 leases · 0.00% of the county's oil · District 01 · Field 04300500
How many drilling permits were filed recently
| Lease and well | Operator | Filed as | Permit | Approved |
|---|---|---|---|---|
| BROWN TRUSTS-BD SA 6 6H | BPX Operating Company | New drill, horizontal | 0919719 | Nov 13, 2026 |
| BROWN TRUSTS-BD SA 5 5H | BPX Operating Company | New drill, horizontal | 0919703 | Nov 13, 2026 |
| CONNELL AVANT A 3H | Rosewood Resources, Inc. | New drill, horizontal | 0919842 | Nov 2, 2026 |
| CONNELL AVANT A 2H | Rosewood Resources, Inc. | New drill, horizontal | 0919841 | Nov 2, 2026 |
| CONNELL AVANT A 1H | Rosewood Resources, Inc. | New drill, horizontal | 0919840 | Nov 2, 2026 |
| MONARCH D 4H | EOG Resources, Inc. | New drill, horizontal | 0919851 | Nov 2, 2026 |
Oil, July 2026, dollars a barrelNew
What oil sold for in July 2026, and what the tax office has on file
Each operator tells the Texas Comptroller the price it got for each lease. Those prices have not reached our records for La Salle County yet, so this part shows the market price and what the operators' parent companies told their investors. Each lease page shows its own price once the Comptroller's records arrive.
The State approved a lower tax on 2,016 of the 2,927 leases
- LOW PRODUCING WELLS
- 1,091 leases
- HIGH COST GAS REDUCED TAX RATE
- 904 leases
- LOW PRODUCING LEASES
- 380 leases
- TWO YEAR INACTIVE WELL
- 10 leases
- Rate, oil
- 0%
4.60% - Newest approval
- October 2026
68.9% of the county's producing leases
On those leases the tax line on a statement should show the lower rate. Each lease page says which wells and until when.
Your statement: the price on your own check stub for a La Salle County lease is the one to set beside the market, the operator's and the tax office's. Check my statement
SourcesMarket: U.S. Energy Information Administration, WTI Cushing. Investor prices: each company's SEC filing, company-wide, not for one county. Tax approvals: Texas Comptroller. Leases sell at different points and qualities, so prices differ for ordinary reasons too.
Watch Plus sets these prices beside the price on each of your statements, every month.See Watch Plus
Who buys the gasNew
Who buys La Salle County's gas
The State lists who buys from each lease. Company filings and the State's operator records show which companies are linked. Each bar is one operator's gas, split by buyer, and every split is an estimate: this record split a lease's gas evenly among its buyers where the P-4 gives no percent, and does not say which splits those are, so no share of the county's gas is stated. A red outline marks a buyer that belongs to the same public company as its operator, per the company's annual report. A buyer with an officer or an address in common with its operator on the State's P-5 records is named but not outlined: that is not shared ownership, and its gas is counted in no share.
- SILVERBOW RESOURCES OPER, LLC and Crescent Energy Operating, LLC are linked: both belong to Crescent Energy Company, per its annual report.
- VERDUN OIL & GAS LLC and Verdun Oil Ef II LLC are linked: an officer in common on the State's P-5 records. That is not shared ownership, and its gas is counted in no share here.
- CRESCENT ENERGY MARKETING, LLC and Crescent Energy Operating, LLC are linked: an officer in common on the State's P-5 records. That is not shared ownership, and its gas is counted in no share here.
Selling to a related company is common and legal. It is also the first thing an auditor looks at, because the price between the two is set inside one company.
SourcesBuyers and gatherers: Railroad Commission Form P-4 records, record dated October 24, 2026, weighted by each lease's gas sold in the 12 months to July 2026. Links: U.S. Securities and Exchange Commission filings and the Railroad Commission's P-5 organization reports. A link marks one buyer under one operator, never the rest of a lease's or the county's gas. This record does not show that each buyer and operator pair here was checked for a link, so a buyer not marked is not known to be unrelated. The other 22 operators are counted in the totals and not drawn.
Royalty Watch tells you the day the buyer of your oil or gas changes.See Royalty Watch
Seen from space, 2025New
Heat at 77 leases in 220 lease months. Flaring reported in 180 of them.
Weather satellites pass over Texas every night and record heat on the ground. For each operator, the amber bar counts the lease months a satellite saw heat at one of its leases. The outlined bar counts the months it reported flaring there.
leases with heat seen at night in 2025.
of 220 lease months with heat also had flaring reported.
lease months with heat seen and a report on file listing no flaring.
Where the county's gas went in 2025, as operators reported it
SourcesHeat: VIIRS active fire readings at night from NOAA-20, NOAA-21 and Suomi NPP (NOAA open data), matched to a lease's wells; a GOES-East reading alone never counts as a night. Satellite record read to November 16, 2026. Reported flaring and gas use: Railroad Commission production reports. Cloud hides heat, so the count is a floor. The satellite records heat. It does not say what burned.
Watch Plus checks whether you were paid on gas in the months heat was seen at your lease.See Watch Plus
Permits, drilling and fracsNew
159 wells on the way. Eight are fracked and waiting.
The State approved 243 drilling locations here in two years. These are the wells still between a permit and a first month of production, one dot for each, at the stage the records showed on November 17, 2026.
Approved, not started
Newest approval: Nov 13Being drilled
Spudded in the 30 days to Nov 17Drilled, no frac on record yet
Middle wait: 141 daysFracked, waiting on a report
Middle wait: 92 days. Longest: 100 daysCompletion filed, no production yet
Middle wait: 291 daysSourcesPermits, drilling dates and completions: Railroad Commission of Texas. Frac dates: FracFocus chemical disclosure registry. Counted November 17, 2026. Newest permit on file for this county: November 13, 2026.
Royalty Watch tells you the day a well on your lease moves to its next stage.See Royalty Watch
Watch Private tells you when a permit or frac is recorded within a mile of your land.See Watch Private
See new drilling on the mapFull well mapPut this map on your site
Do your La Salle County checks match the State?
Own minerals here? Add your leases to My leases and see your share of every month.
Example
A whole month was never paid
The State shows 28,175 barrels of oil sold from the lease in the month its operator changed from Operator A to Operator B, so the owner's share is 27.51 barrels. No statement covers that month.
Ask Operator B's owner relations: is that month held in suspense after the change of operator?
$2,277oil and gas
A sample finding, from our example check.
Around this county
Nearby
Where it sits
This county
Towns
- Gardendale1,522 wells within 10 miles
- Cotulla1,521 wells within 10 miles
Fields
- Eagleville (Eagle Ford-1)1,764 leases
- Hawkville (Eagleford Shale)647 leases
- Briscoe Ranch (Eagleford)118 leases
- A.w.p. (Olmos)19 leases
- Tres Encanto (Escondido)12 leases
Newest drilling permits
- BROWN TRUSTS-BD SA 6 6HNew drill, horizontal · approved Nov 13 · BPX Operating Company
- BROWN TRUSTS-BD SA 5 5HNew drill, horizontal · approved Nov 13 · BPX Operating Company
- CONNELL AVANT A 3HNew drill, horizontal · approved Nov 2 · Rosewood Resources, Inc.
- CONNELL AVANT A 2HNew drill, horizontal · approved Nov 2 · Rosewood Resources, Inc.
- CONNELL AVANT A 1HNew drill, horizontal · approved Nov 2 · Rosewood Resources, Inc.
More on La Salle County
- Every lease in La Salle County, A to Z3,479 lease pages, listed 100 to a page.
- Every operator in La Salle County57 operators with leases here, the biggest first.
- La Salle County drilling permitsThe newest permits, completions and first production, free.
- La Salle County property tax protestHow to protest a mineral value with La Salle County Appraisal District.
- Texas operators, A to ZEvery operator with producing leases, and its report card.
- Check a stub against a leaseMatch the barrels and mcf on your stub to the state record.
- Lewis Petro Properties, Inc.Led the county's leases since 1995; reports 609 leases here now.
- Verdun Oil Ef II LLCTook 432 leases from Ep Energy in 2025; reports 491 leases here now.
- EOG Resources, Inc.Filed 28 drilling permits in the last 12 months, the most of any operator.
- Eagleville (Eagle Ford-1)Top field by oil now, ranked first in the county.
- Hawkville (Eagleford Shale)Top field by gas now, with 226,460,197 mcf in the last 12 months.
Where this page comes from
- Railroad Commission of Texas production, Form P-4, permits, wells, cut-offs
- La Salle County Appraisal District 2026 mineral roll
- Texas Comptroller tax approvals
- U.S. Energy Information Administration prices
- SEC EDGAR company filings
- FracFocus frac dates
- NOAA storms and cold
- NOAA open data VIIRS night heat (NOAA-20, NOAA-21, Suomi NPP)
- U.S. Census Bureau county shapes