
Texas county · RRC district 01
McMullen County, Texas oil and gas
- 26,243,155bbl oil in the last 12 months
- 1,659producing leases
- 4,079wells on the map
- 239drilling locations in two years
Oil wells and drilling locations in McMullen County
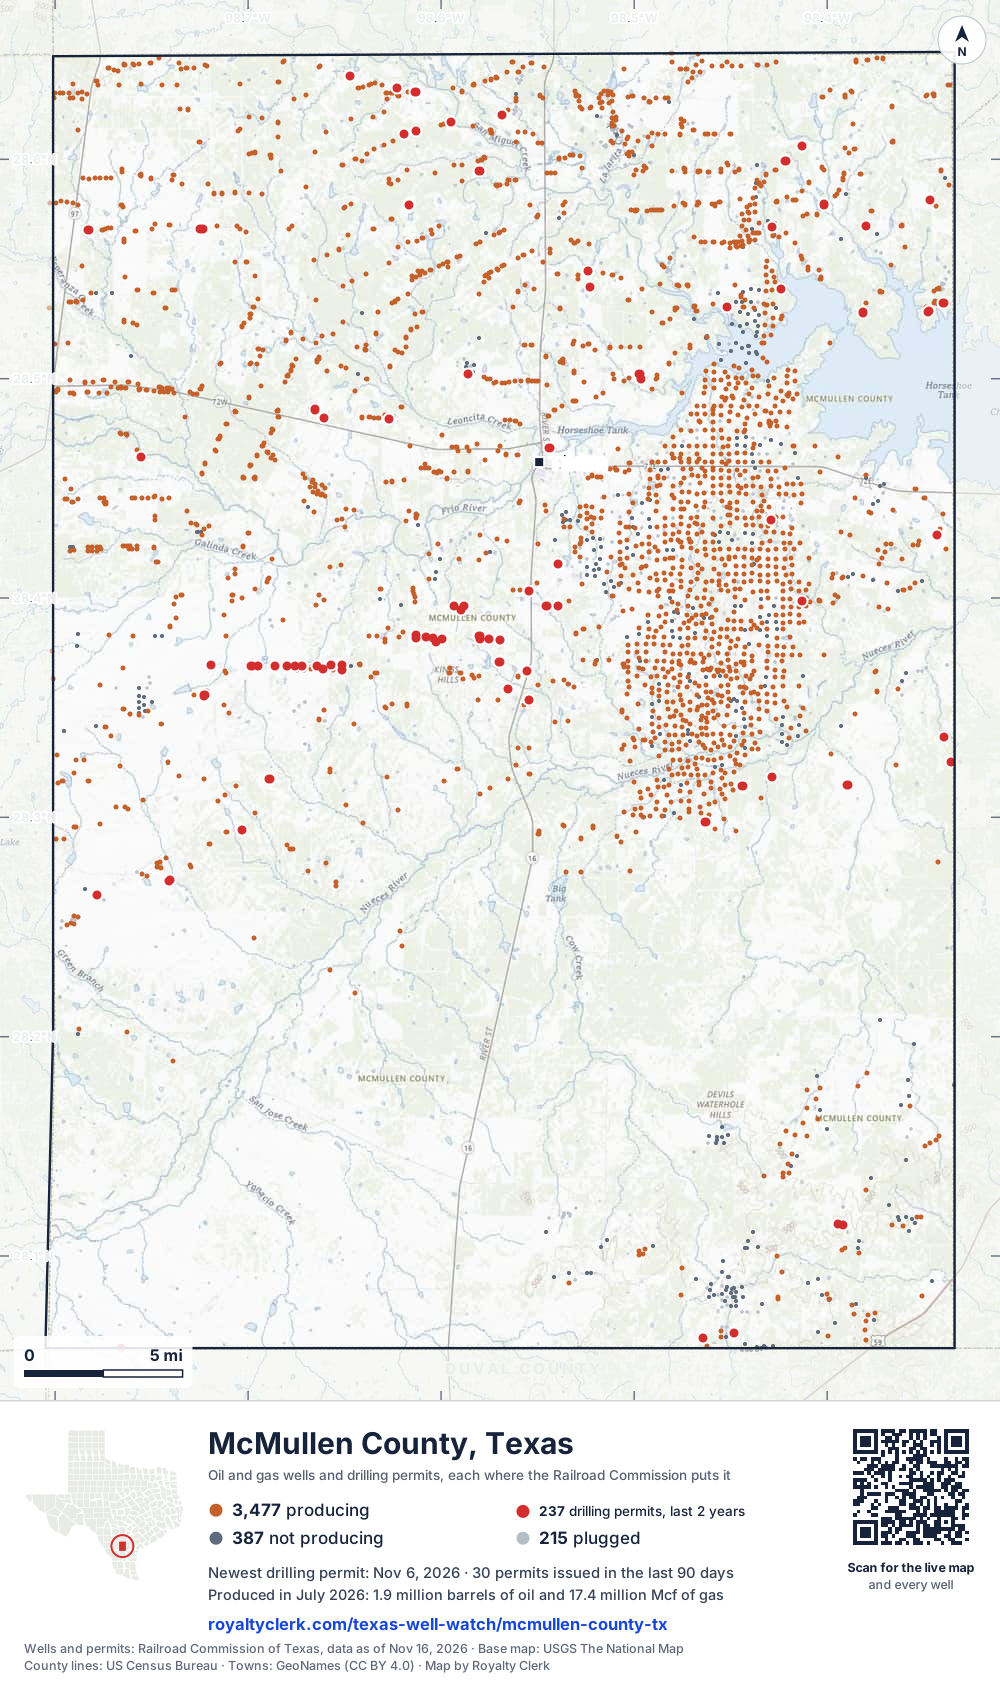
- Drilling locations239Permits issued in the last two years
- Producing wells3,477On a lease reporting production now
- Not producing389Shut in, inactive or no lease on record
- Plugged213The state's wellbore record says plugged
Sources: Railroad Commission of Texas well layers and permit files, US Census Bureau county outline, town points from GeoNames (CC BY 4.0), base map from USGS The National Map. A dot is a surface location; a horizontal well runs a mile or more from it.
4,079 wells with a location on the state's map (3,477 producing, 389 not producing, 213 plugged) and 239 drilling locations permitted in the last 24 months, each where the Railroad Commission puts it.
Use this map on your site
You may show this map on any site, unchanged. Keep the credit line and its link to Royalty Clerk under the map. The picture updates by itself as the state records new wells and permits.
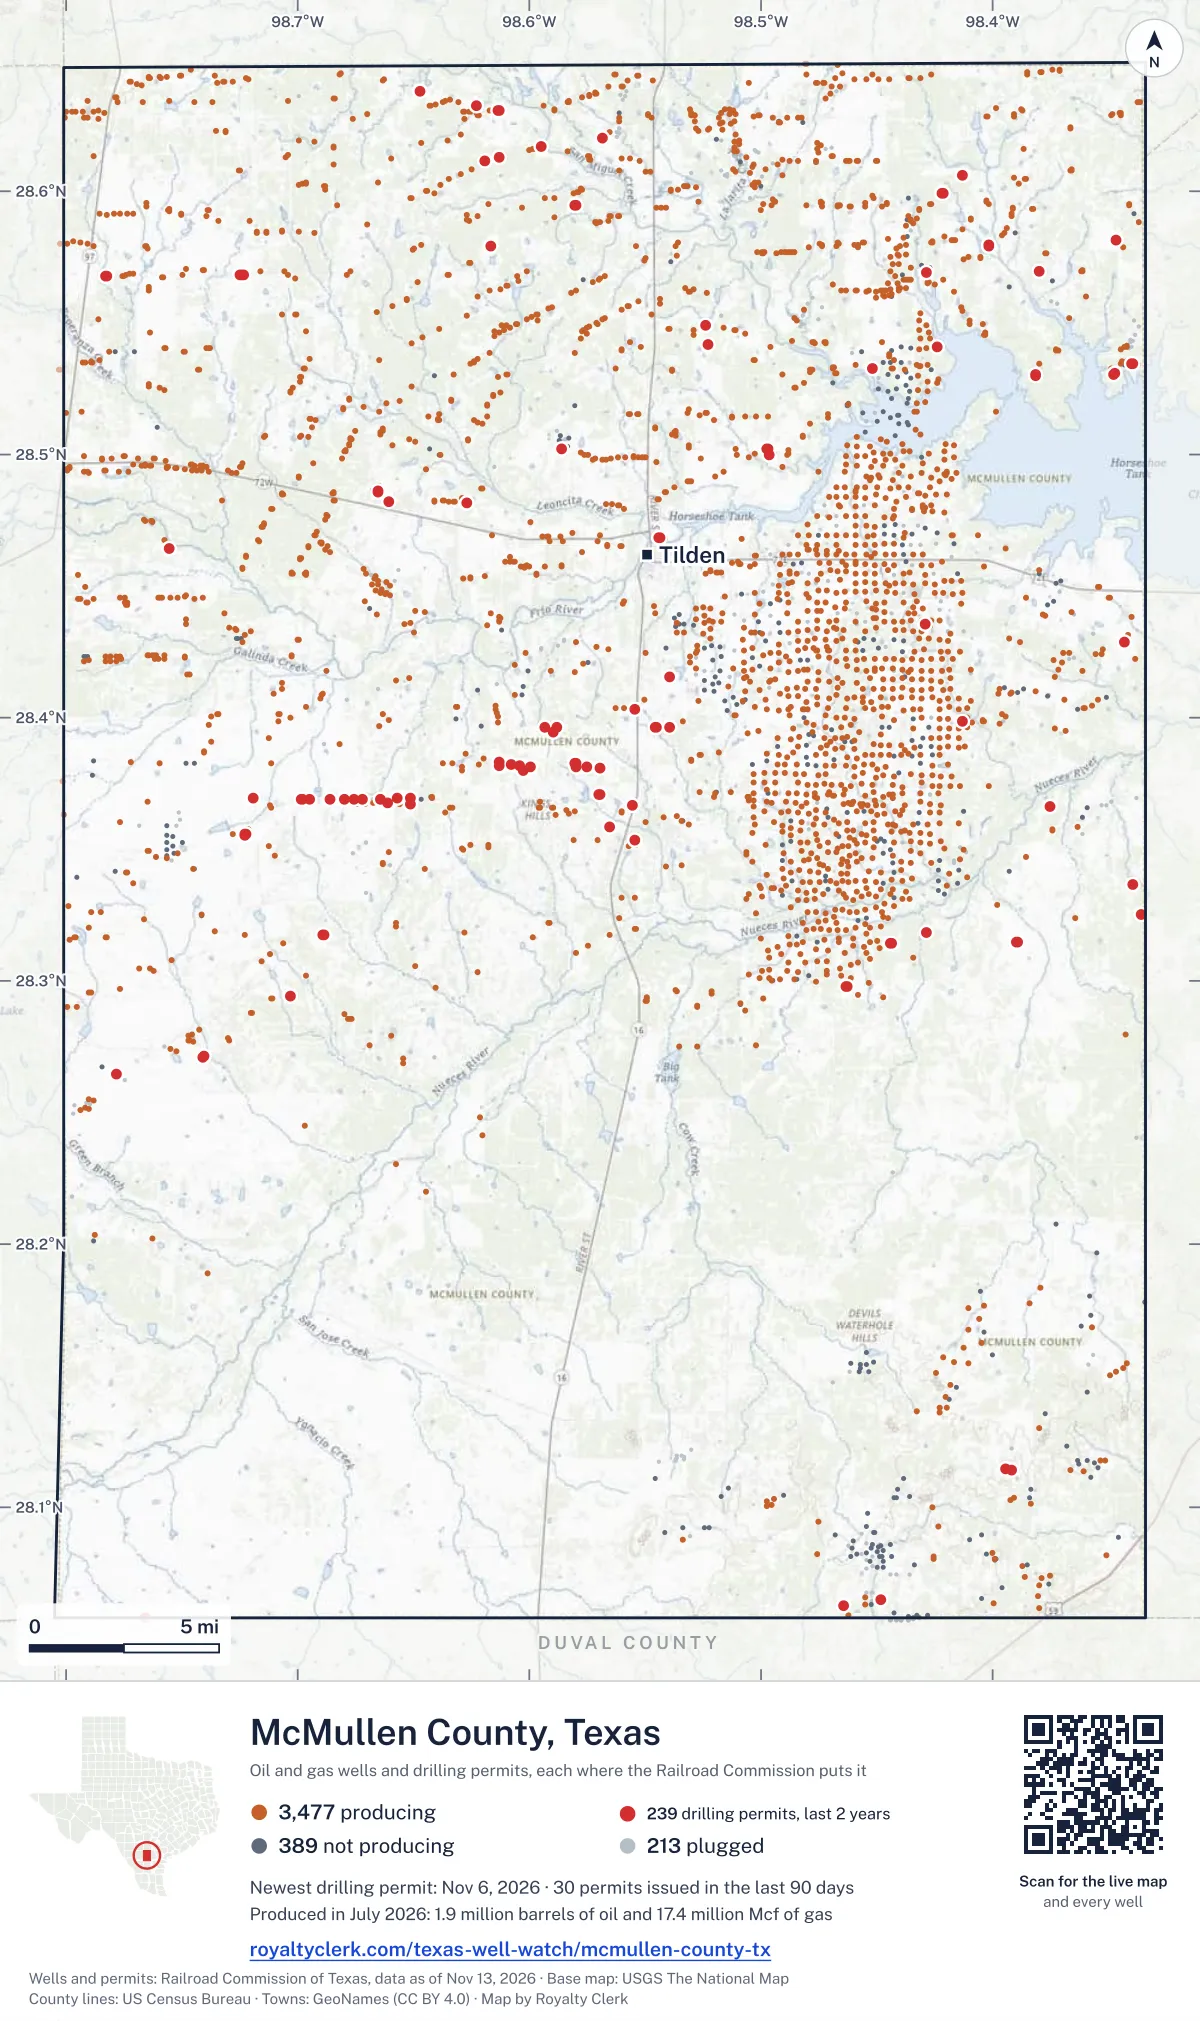
<a href="https://royaltyclerk.com/texas/counties/mcmullen-county-tx"><img src="https://royaltyclerk.com/maps/county-wells/mcmullen-county-tx.svg" alt="Map of McMullen County, Texas, with 4,079 oil and gas wells and 239 recent drilling locations as dots." width="1000" height="1684" loading="lazy" style="max-width:100%;height:auto;border:0"></a>
<p style="margin:4px 0 0;font-size:14px">Map: <a href="https://royaltyclerk.com/texas/counties/mcmullen-county-tx">McMullen County, Texas oil and gas wells</a> by Royalty Clerk, from Railroad Commission of Texas records</p>
Wells near a town: Tilden · Newest drilling permits in McMullen County · Wells by ZIP code
McMullen County is one of the 27 counties of the Eagle Ford Shale
McMullen County reported 26 million barrels of oil and 206 million mcf of gas in the last 12 months. That ranks 18th of 225 Texas counties by oil.
County dossier
August 2026 is still coming in. About 89% of Texas leases have reported it so far, so this page counts through July 2026 until it is fully reported.
- Producing leases
- 1,659of 2,057 on record
- Operators
- 60
- Fields
- 60
- Top operator
- BPX Operating Company
Own minerals in McMullen County?
A family member owned minerals here?
Search their name: a family member who owned minerals hereWhere it sits
This county
- Gas, last 12 months
- 205,813,650 mcf
- Share of Texas oil
- 1.3%
- Wells on record
- 4,097on leases with production reports
- Data through
- Jul 2026
Five years of output in McMullen County
Oil output in McMullen County fell 17% over the last 12 months
26M bbl through Jul 2026, against 32M bbl a year earlier. Peak Oct 2024: 3M bbl.
Gas output in McMullen County held steady over the last 12 months
206M mcf through Jul 2026, against 204M mcf a year earlier. Peak Jul 2025: 20M mcf.
SourceTexas Railroad Commission Production Data Query, county totals, through Jul 2026, file dated Oct 20, 2026.
Cite or embed this chart
Free to use for McMullen County, Texas, with a credit and a link. Copy what you need.
Credit line
Source: Royalty Clerk analysis of Texas Railroad Commission filings, https://royaltyclerk.com/texas/counties/mcmullen-county-tx, data to July 2026.
The chart on your own page
Free to embed on any site. Keep the “Source: Royalty Clerk” link under the chart.
See the code
<iframe
  src="https://royaltyclerk.com/embed/counties/mcmullen-county-tx"
  title="Royalty Clerk: oil and gas production, McMullen County, Texas"
  width="100%"
  height="400"
  style="border:0"
  loading="lazy"></iframe>
<p style="margin:4px 0 0;font-size:14px">Source: <a href="https://royaltyclerk.com/texas/counties/mcmullen-county-tx" target="_blank">Royalty Clerk</a></p>
<script>
window.addEventListener("message", function (e) {
  if (e.origin !== "https://royaltyclerk.com" || !e.data || e.data.type !== "rc-embed-height") return;
  var frames = document.getElementsByTagName("iframe");
  for (var i = 0; i < frames.length; i++) {
    if (frames[i].contentWindow === e.source && e.data.height > 0) frames[i].style.height = Number(e.data.height) + "px";
  }
});
</script>
McMullen County oil and gas production by year, 1993 to 2025
Every full year we hold, 1993 to 2025. The highest year for oil since 1993 was 2014, at 47,554,825 bbl. The highest year for gas was 2024, at 203,530,427 mcf.
| Year | Oilbbl | Gasmcf |
|---|---|---|
| 2025 | 29,141,033 | 201,180,710 |
| 2024 | 30,111,141 | 203,530,427 |
| 2023 | 26,772,443 | 146,473,444 |
| 2022 | 22,212,287 | 103,951,999 |
| 2021 | 23,543,646 | 82,049,697 |
| 2020 | 27,962,638 | 103,053,039 |
| 2019 | 31,609,162 | 102,253,876 |
| 2018 | 31,566,191 | 85,957,637 |
| 2017 | 30,660,017 | 80,562,032 |
| 2016 | 37,973,607 | 98,009,301 |
| 2015 | 45,381,209 | 118,769,367 |
| 2014 | 47,554,825 | 139,042,163 |
| 2013 | 31,558,101 | 121,080,285 |
| 2012 | 15,809,600 | 80,789,843 |
| 2011 | 5,429,577 | 52,455,041 |
| 2010 | 2,223,495 | 29,779,564 |
| 2009 | 1,593,519 | 24,249,627 |
| 2008 | 1,551,715 | 24,293,745 |
| 2007 | 1,384,249 | 29,067,423 |
| 2006 | 1,344,957 | 41,354,816 |
| 2005 | 1,278,734 | 59,245,527 |
| 2004 | 1,242,701 | 49,426,376 |
| 2003 | 1,132,016 | 31,386,006 |
| 2002 | 1,153,129 | 23,951,294 |
| 2001 | 1,374,288 | 27,737,403 |
| 2000 | 1,459,947 | 32,311,537 |
| 1999 | 1,397,138 | 34,567,984 |
| 1998 | 1,724,282 | 42,117,058 |
| 1997 | 1,880,584 | 43,119,988 |
| 1996 | 1,837,806 | 41,840,397 |
| 1995 | 1,815,174 | 34,581,448 |
| 1994 | 1,915,212 | 36,529,034 |
| 1993 | 2,228,998 | 41,364,996 |
SourceTexas Railroad Commission production records, added up by county and calendar year. Oil includes condensate; gas includes casinghead gas. The year in progress is left out until it is complete.
The biggest leases in McMullen County
Under each volume: change on the year before.
944,631bbl oil+85%
838,571bbl oil+18%
830,261bbl oil−24%
744,189bbl oil+137%
697,369bbl oiln/a
575,985bbl oil+875%
509,705bbl oil−49%
388,769bbl oil−19%
384,861bbl oiln/a
365,984bbl oil−43%
251,291bbl oil−38%
196,555bbl oil−9%
4,240,737mcf gasn/a
179,393bbl oil−19%
4,138,165mcf gasn/a
171,452bbl oil−57%
168,965bbl oil−8%
165,709bbl oil−33%
163,830bbl oiln/a
3,738,007mcf gasn/a
160,137bbl oiln/a
3,658,325mcf gasn/a
155,523bbl oiln/a
3,554,403mcf gasn/a
152,112bbl oiln/a
Showing 25 of 150 (the 150 largest of 1,659), ranked by output value.
SourceTexas Railroad Commission Production Data Query.
Who runs the leases, and what they produce
Operators in McMullen County, by oil
EOG Resources leads
- EOG Resources, Inc.150 leases5.7Mbbl
- Ineos USA Oil & Gas LLC115 leases3.7Mbbl
- BPX Operating Company277 leases3.4Mbbl
- Gulftex Energy, LLC45 leases2.7Mbbl
- Burlington Resources O & G Co LP4 leases1.6Mbbl
- Murphy Expl. & Prod. Co. - USA36 leases1.6Mbbl
- Crescent Energy Operating, LLC110 leases1.5Mbbl
- Verdun Oil & Gas LLC49 leases1.3Mbbl
Fields in McMullen County, by oil
Eagleville (Eagle Ford-1) leads
- Eagleville (Eagle Ford-1)735 leases · District 01 · Field 2713570023Mbbl
- Hawkville (Eagleford Shale)284 leases · District 01 · Field 397445002.1Mbbl
- Sugarkane (Eagle Ford)4 leases · District 02 · Field 86950600746kbbl
- A.w.p. (Olmos)530 leases · District 01 · Field 00256500229kbbl
- San Miguel Creek (Wilcox Cons.)12 leases · District 01 · Field 8030092537.3kbbl
- Dilworth (Carrizo)1 lease · District 01 · Field 2480626726.9kbbl
- Baker (2500)2 leases · District 01 · Field 0512275013.8kbbl
- Indio Tanks (Pearsall)2 leases · District 01 · Field 445105005,678bbl
More operators here
Recent drilling permits in McMullen County
SAUTERELLE UNIT A #2H
new drill · horizontal · Verdun Oil & Gas LLC · McMullen County
Permit 0919908 · Nov 6, 2026
SAUTERELLE UNIT A #1H
new drill · horizontal · Verdun Oil & Gas LLC · McMullen County
Permit 0919907 · Nov 6, 2026
CHINE 101HF #101HF
new drill · horizontal · Crescent Energy Operating, LLC · McMullen County
Permit 0919558 · Oct 30, 2026
CHINE 101HE #101HE
new drill · horizontal · Crescent Energy Operating, LLC · McMullen County
Permit 0919557 · Oct 30, 2026
CHINE 101HD #101HD
new drill · horizontal · Crescent Energy Operating, LLC · McMullen County
Permit 0919556 · Oct 30, 2026
CHINE 101HC #101HC
new drill · horizontal · Crescent Energy Operating, LLC · McMullen County
Permit 0919554 · Oct 30, 2026