
Texas county · RRC district 8A
Motley County, Texas oil and gas
- 23,750bbl oil in the last 12 months
- 11producing leases
- 44wells on the map
- 3drilling locations in two years
The story
Who runs Motley County's oil now
Motley County is an oil county with almost no gas. Its biggest full calendar year for oil was 1995, at 150,568 barrels. In 2025 the county reported 26,028 barrels and no gas.
Rogers, S. K. Oil, Inc. was the leading operator in every full calendar year from 1993 to 2025. Patton, E. N. Oil Company, Inc. has reported here since 2013. In the last 12 months it reported more than half of the county's oil and gas: 57.7%.
Matador Operating, LLC handed three leases to Geomark Resources, L.L.C. in 2024, the year four leases stopped reporting. One operator, Yost Exploration and Production, filed both drilling permits in the last 12 months.
Not a forecast, not reserves.
Key moments
- 1995Oil reached 150,568 barrels, the biggest full calendar year for oil
- 2003Laloc took over four leases from Cogdell Oil Company, Inc.
- 2013Patton, E. N. Oil Company, Inc. first reports production here
- 2016Buffco Production Inc. took four leases from Laloc
- 2023Ableready, Inc. took three leases from Buffco Production Inc.
- 2024Geomark Resources, L.L.C. took three leases from Matador Operating, LLC
- 2025Oil fell to 26,028 barrels, and no gas was reported
Oil wells and drilling locations in Motley County
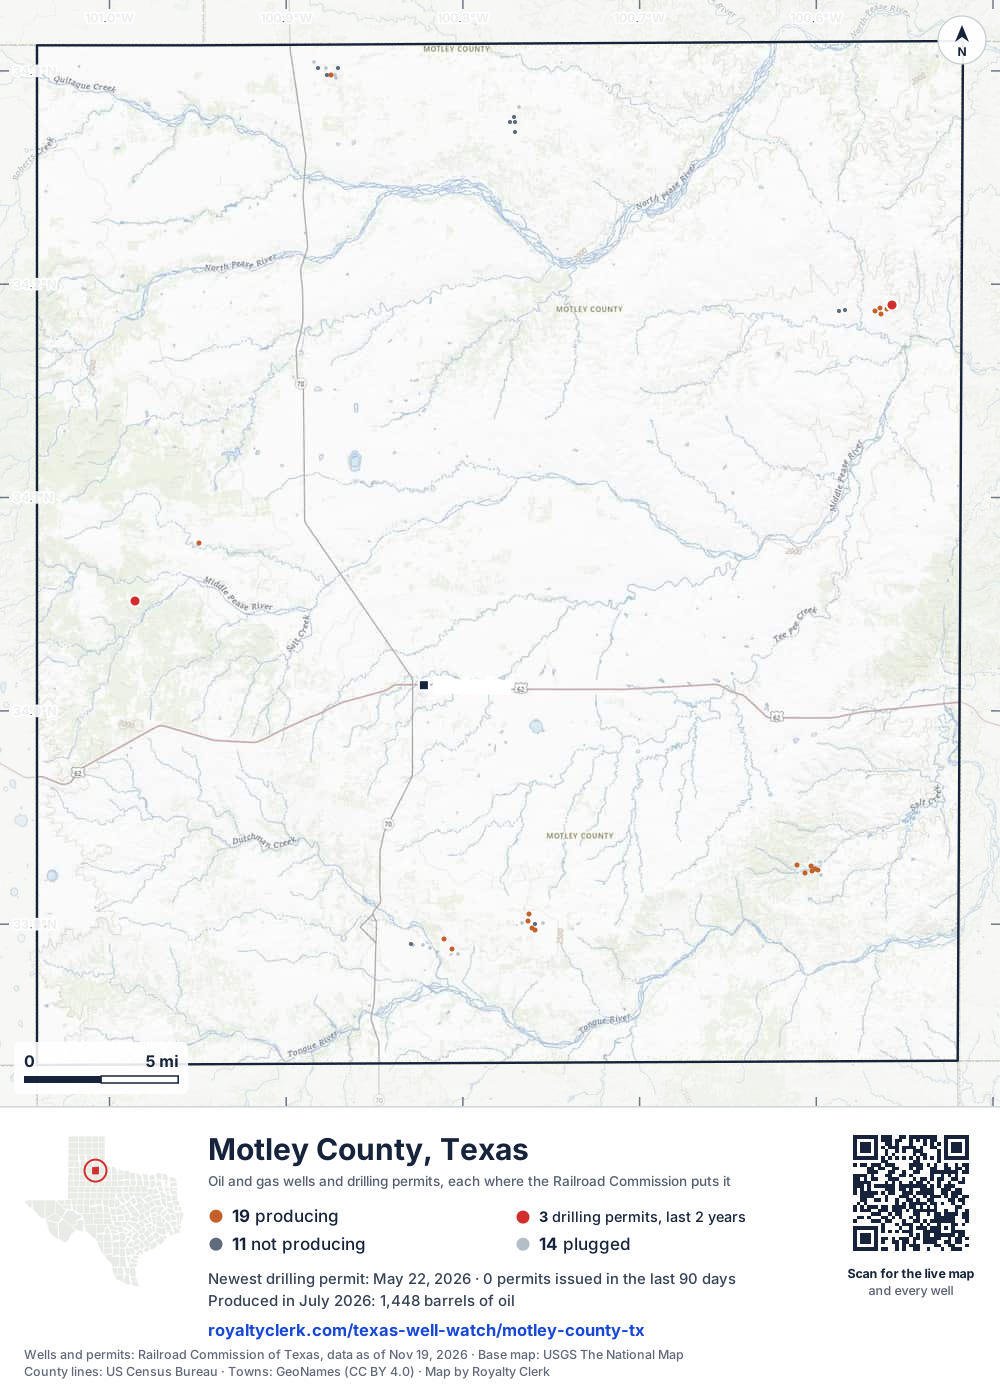
- Drilling locations3Permits issued in the last two years
- Producing wells19On a lease reporting production now
- Not producing11Shut in, inactive or no lease on record
- Plugged14The state's wellbore record says plugged
Sources: Railroad Commission of Texas well layers and permit files, US Census Bureau county outline, town points from GeoNames (CC BY 4.0), base map from USGS The National Map. A dot is a surface location; a horizontal well runs a mile or more from it.
44 wells with a location on the state's map (19 producing, 11 not producing, 14 plugged) and 3 drilling locations permitted in the last 24 months, each where the Railroad Commission puts it.
Use this map on your site
You may show this map on any site, unchanged. Keep the credit line and its link to Royalty Clerk under the map. The picture updates by itself as the state records new wells and permits.
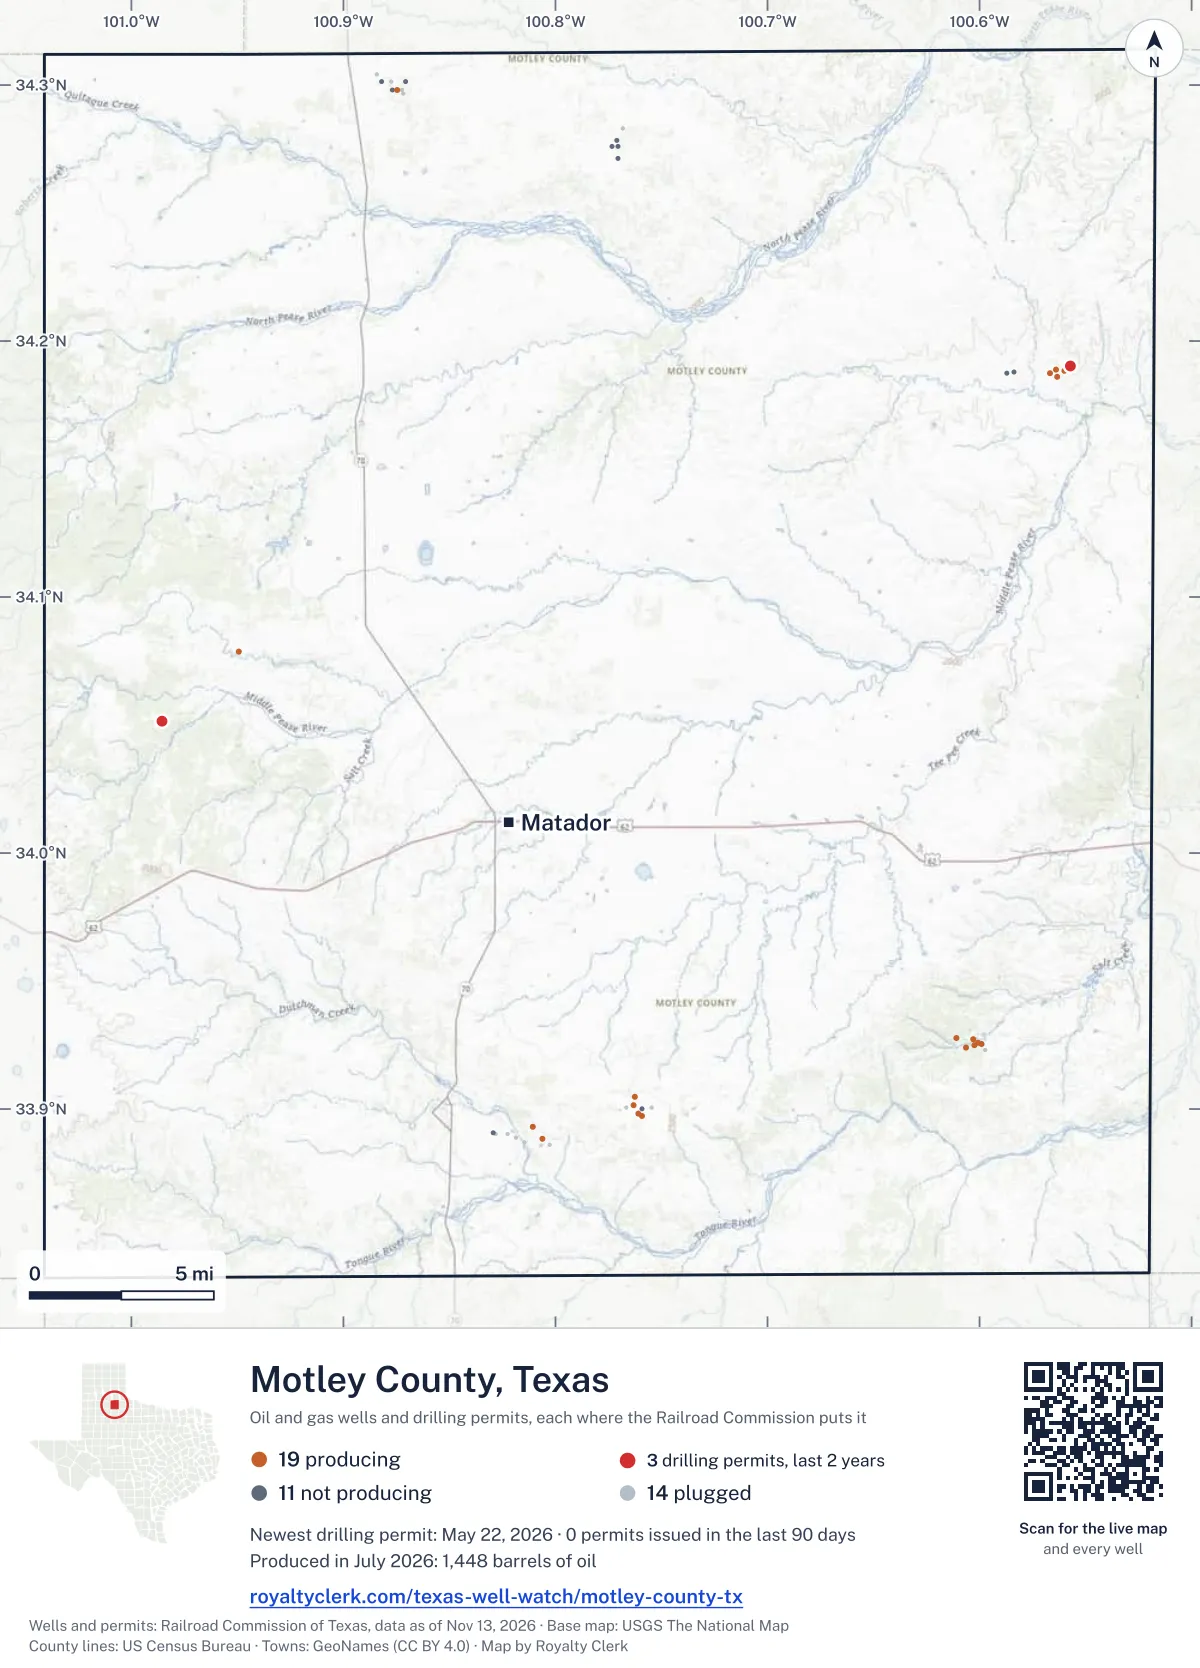
<a href="https://royaltyclerk.com/texas/counties/motley-county-tx"><img src="https://royaltyclerk.com/maps/county-wells/motley-county-tx.svg" alt="Map of Motley County, Texas, with 44 oil and gas wells and 3 recent drilling locations as dots." width="1000" height="1390" loading="lazy" style="max-width:100%;height:auto;border:0"></a>
<p style="margin:4px 0 0;font-size:14px">Map: <a href="https://royaltyclerk.com/texas/counties/motley-county-tx">Motley County, Texas oil and gas wells</a> by Royalty Clerk, from Railroad Commission of Texas records</p>
Wells near a town: Matador · Newest drilling permits in Motley County · Wells by ZIP code
Motley County is one of the 61 counties of the Permian Basin
Motley County reported 23,750 barrels of oil in the last 12 months. That ranks 187th of 225 Texas counties by oil.
County dossier
August 2026 is still coming in. About 89% of Texas leases have reported it so far, so this page counts through July 2026 until it is fully reported.
- Producing leases
- 11of 21 on record
- Operators
- 6
- Fields
- 6
- Top operator
- Patton, E. N. Oil Company, Inc.
Own minerals in Motley County?
A family member owned minerals here?
Search their name: a family member who owned minerals hereWhere it sits
This county
- Share of Texas oil
- <0.1%
- Wells on record
- 46on leases with production reports
- Data through
- Jul 2026
- Top field
- The 8th Dimension (Canyon Reef)
If you own here
- Mineral interest finder
Motley County has 21 leases on record, and six operators now report them. It searches a name on county mineral rolls for accounts and leases.
- Find the land on my deed
Motley County has six fields and 2 permits filed in the last 12 months. It finds a survey or abstract number's wells and permits.
- Royalty calculator
Motley County reported 23,750 barrels of oil and no gas in the last 12 months. It turns volume, price and decimal into an estimated check.
Questions owners ask
- Who runs the leases in Motley County now?
- Six operators reported here in 2025. Patton, E. N. Oil Company, Inc. reported more than half of the county's oil and gas in the last 12 months: 57.7%. The 3 biggest operators reported a little over three quarters of it: 80.8%.
- Where is the land on my deed?
- The state lists 21 leases on record in Motley County, and 11 of them are producing now. Six fields hold them. The Roaring Springs (Permo-Penn) field has 11 leases on record, and 4 of them are producing. Find the land on my deed
- What should my royalty check look like?
- Motley County reported 23,750 barrels of oil and no gas in the last 12 months. A royalty check depends on your own lease's volume, price and decimal. The calculator uses those numbers to estimate a check for your lease. Royalty calculator
Related pages
- Patton, E. N. Oil Company, Inc.
Reported more than half of the county's output in the last 12 months.
- Rogers, S. K. Oil, Inc.
Was the leading operator in every full calendar year from 1993 to 2025.
- Geomark Resources, L.L.C.
Took three leases from Matador Operating, LLC in 2024.
- The 8th Dimension (Canyon Reef)
Holds 14,012 barrels, the largest field output in the county now.
- Roaring Springs (Permo-Penn)
Has 11 leases on record and four producing leases now.
From the state's records through July 2026.
Oil over the last five years, month by month
Oil output in Motley County fell 10% over the last 12 months
23.8k bbl through Jul 2026, against 26.4k bbl a year earlier. Peak May 2024: 4,265 bbl.
Gas output in Motley County: 0 mcf in the last 12 months
0 mcf through Jul 2026. Peak Sep 2021: 449 mcf.
SourceTexas Railroad Commission Production Data Query, county totals, through Jul 2026, file dated Oct 20, 2026.
Cite or embed this chart
Free to use for Motley County, Texas, with a credit and a link. Copy what you need.
Credit line
Source: Royalty Clerk analysis of Texas Railroad Commission filings, https://royaltyclerk.com/texas/counties/motley-county-tx, data to July 2026.
The chart on your own page
Free to embed on any site. Keep the “Source: Royalty Clerk” link under the chart.
See the code
<iframe
  src="https://royaltyclerk.com/embed/counties/motley-county-tx"
  title="Royalty Clerk: oil and gas production, Motley County, Texas"
  width="100%"
  height="400"
  style="border:0"
  loading="lazy"></iframe>
<p style="margin:4px 0 0;font-size:14px">Source: <a href="https://royaltyclerk.com/texas/counties/motley-county-tx" target="_blank">Royalty Clerk</a></p>
<script>
window.addEventListener("message", function (e) {
  if (e.origin !== "https://royaltyclerk.com" || !e.data || e.data.type !== "rc-embed-height") return;
  var frames = document.getElementsByTagName("iframe");
  for (var i = 0; i < frames.length; i++) {
    if (frames[i].contentWindow === e.source && e.data.height > 0) frames[i].style.height = Number(e.data.height) + "px";
  }
});
</script>
Oil and gas by year, back to January 1993
Every full year we hold, 1993 to 2025. The highest year for oil since 1993 was 1995, at 150,568 bbl. The highest year for gas was 1994, at 8,185 mcf.
| Year | Oilbbl | Gasmcf |
|---|---|---|
| 2025 | 26,028 | 0 |
| 2024 | 30,346 | 78 |
| 2023 | 20,457 | 1,387 |
| 2022 | 26,753 | 2,125 |
| 2021 | 31,668 | 3,374 |
| 2020 | 33,059 | 3,955 |
| 2019 | 38,937 | 5,199 |
| 2018 | 36,455 | 4,621 |
| 2017 | 34,572 | 2,960 |
| 2016 | 29,786 | 2,495 |
| 2015 | 36,581 | 3,401 |
| 2014 | 27,632 | 1,870 |
| 2013 | 18,658 | 217 |
| 2012 | 23,390 | 0 |
| 2011 | 28,080 | 0 |
| 2010 | 31,285 | 0 |
| 2009 | 30,623 | 0 |
| 2008 | 29,124 | 0 |
| 2007 | 31,201 | 0 |
| 2006 | 39,953 | 0 |
| 2005 | 45,187 | 12 |
| 2004 | 59,269 | 84 |
| 2003 | 60,860 | 86 |
| 2002 | 47,695 | 2,057 |
| 2001 | 55,552 | 3,060 |
| 2000 | 67,940 | 3,032 |
| 1999 | 61,128 | 3,051 |
| 1998 | 90,203 | 3,064 |
| 1997 | 93,382 | 3,478 |
| 1996 | 121,120 | 4,023 |
| 1995 | 150,568 | 3,909 |
| 1994 | 145,155 | 8,185 |
| 1993 | 134,309 | 6,075 |
SourceTexas Railroad Commission production records, added up by county and calendar year. Oil includes condensate; gas includes casinghead gas. The year in progress is left out until it is complete.
Which leases produce the most here now
Under each volume: change on the year before.
9,430bbl oil−20%
4,582bbl oil−24%
2,498bbl oil+212%
1,715bbl oil+38%
1,692bbl oil+52%
1,239bbl oil+10%
1,052bbl oil+10%
812bbl oil+1%
465bbl oil+10%
445bbl oil−3%
341bbl oil+10%
Showing 11 of 11, ranked by output value.
SourceTexas Railroad Commission Production Data Query.
Who runs the leases, and what they produce
Operators in Motley County, by oil
Which operators produce the most here now
Fields in Motley County, by oil
Which fields produce the most here now
- The 8th Dimension (Canyon Reef)2 leases · District 8A · Field 8923850014kbbl
- Roaring Springs (Permo-Penn)4 leases · District 8A · Field 771275003,097bbl
- Matador (Wolfcamp)1 lease · District 8A · Field 581844752,498bbl
- Roaring Springs, W. (Permo-Penn)2 leases · District 8A · Field 771345002,160bbl
- Gupton (Canyon)1 lease · District 8A · Field 375042001,692bbl
- Birnie (Congl.)1 lease · District 8A · Field 08367250812bbl
More operators here
Search this county →Who filed recent drilling permits here
BLACK 4 #3
new drill · Yost Exploration and Production · Motley County
Permit 0915757 · May 22, 2026
BLACK 4 #2
new drill · Yost Exploration and Production · Motley County
Permit 0915755 · May 22, 2026
TAYLOR 'C' #7
new drill · Patton, E. N. Oil Company, Inc. · Motley County
Permit 0907030 · Apr 2, 2025
MOORE #1
new drill · Gunn Oil Company · Motley County
Permit 0902788 · Sep 20, 2024
SHOENAIL #2
new drill · Patton, E. N. Oil Company, Inc. · Motley County
Permit 0895505 · Nov 30, 2023