
Texas county · RRC district 10
Potter County, Texas oil and gas
- 7,815,055mcf gas in the last 12 months
- 525producing leases
- 1,356wells on the map
- 14drilling locations in two years
Oil wells and drilling locations in Potter County
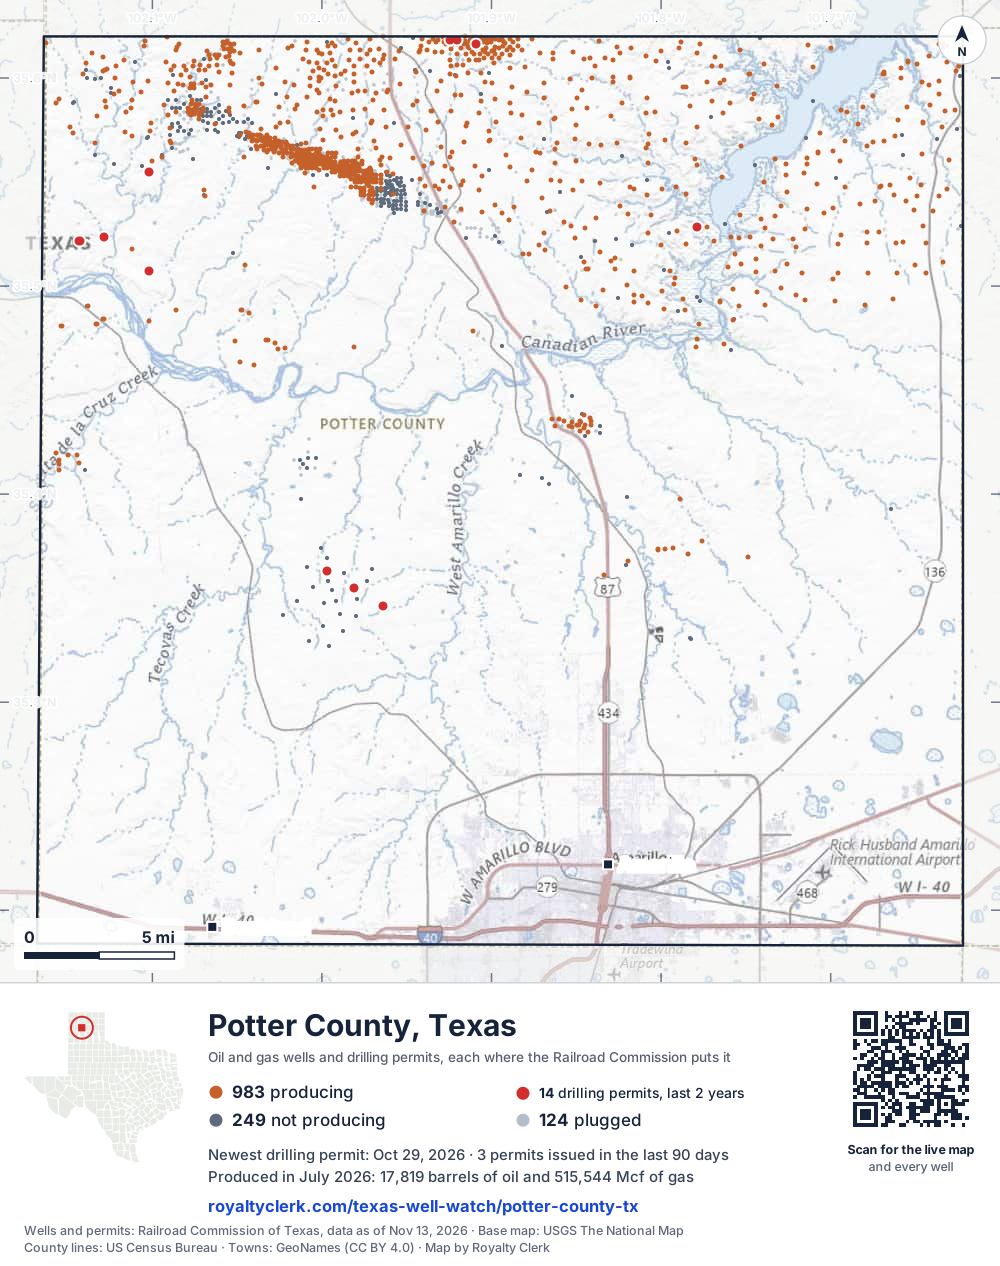
- Drilling locations14Permits issued in the last two years
- Producing wells983On a lease reporting production now
- Not producing251Shut in, inactive or no lease on record
- Plugged122The state's wellbore record says plugged
Sources: Railroad Commission of Texas well layers and permit files, US Census Bureau county outline, town points from GeoNames (CC BY 4.0), base map from USGS The National Map. A dot is a surface location; a horizontal well runs a mile or more from it.
1,356 wells with a location on the state's map (983 producing, 251 not producing, 122 plugged) and 14 drilling locations permitted in the last 24 months, each where the Railroad Commission puts it.
Use this map on your site
You may show this map on any site, unchanged. Keep the credit line and its link to Royalty Clerk under the map. The picture updates by itself as the state records new wells and permits.
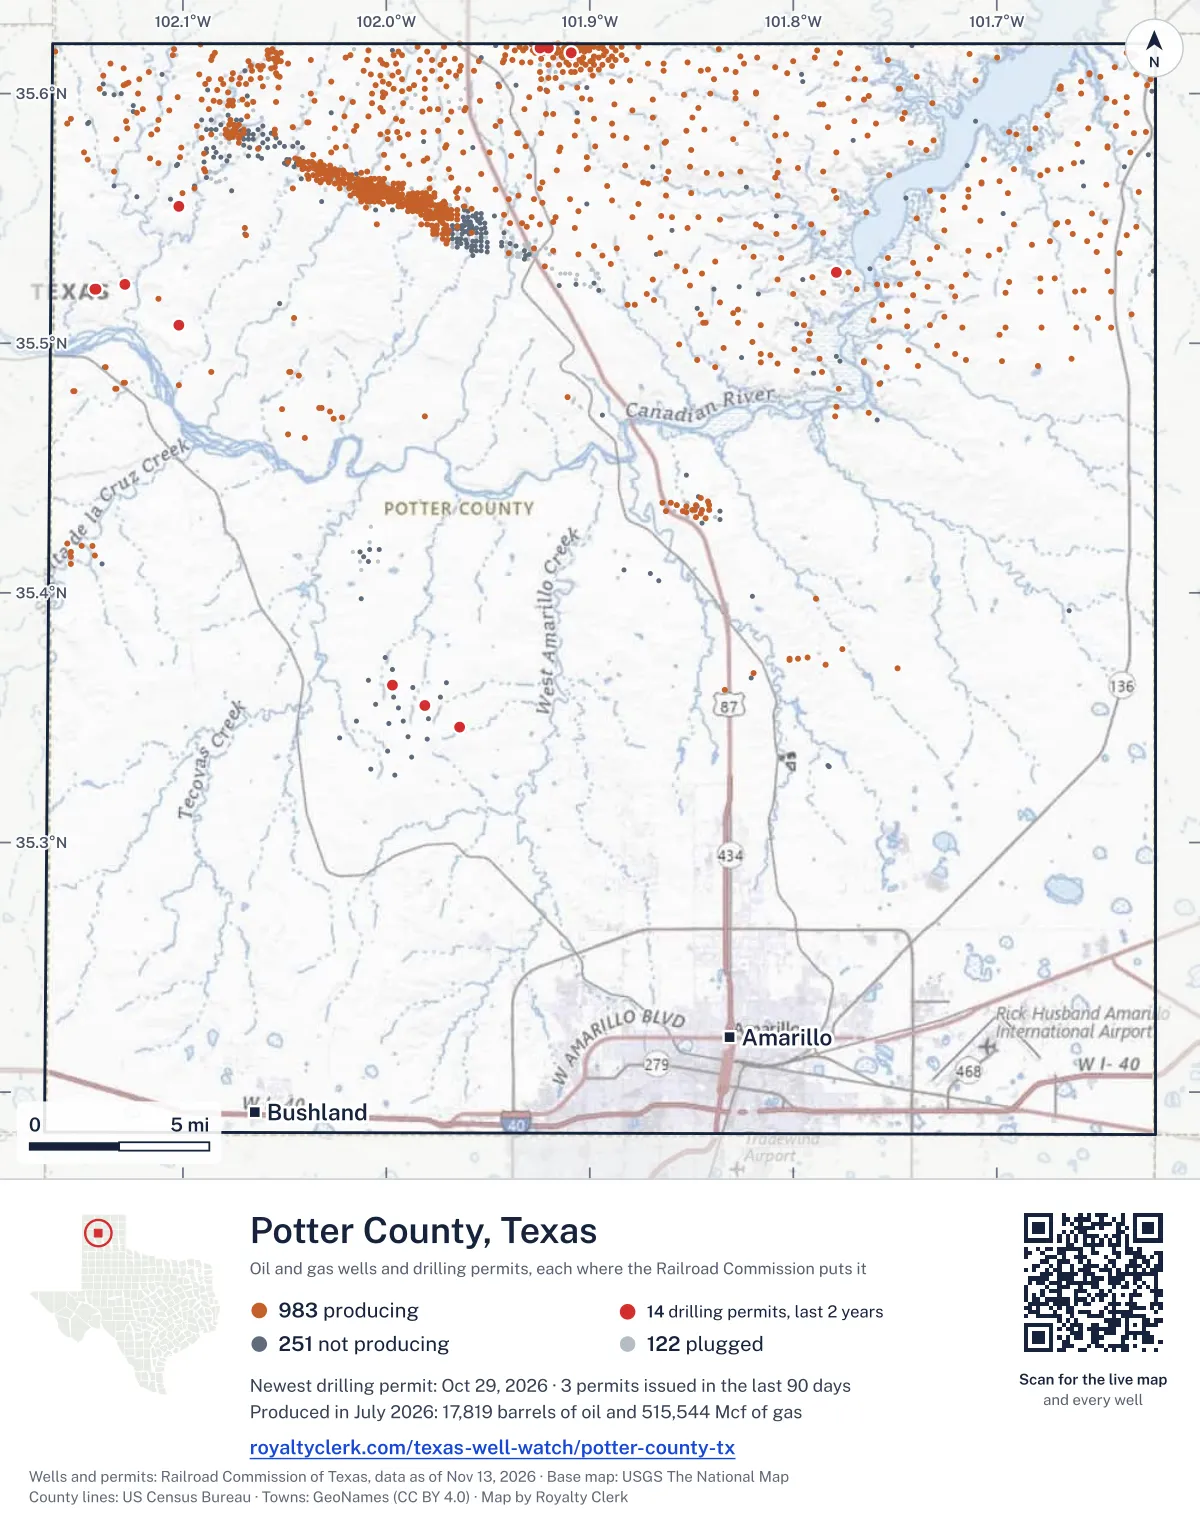
<a href="https://royaltyclerk.com/texas/counties/potter-county-tx"><img src="https://royaltyclerk.com/maps/county-wells/potter-county-tx.svg" alt="Map of Potter County, Texas, with 1,356 oil and gas wells and 14 recent drilling locations as dots." width="1000" height="1266" loading="lazy" style="max-width:100%;height:auto;border:0"></a>
<p style="margin:4px 0 0;font-size:14px">Map: <a href="https://royaltyclerk.com/texas/counties/potter-county-tx">Potter County, Texas oil and gas wells</a> by Royalty Clerk, from Railroad Commission of Texas records</p>
Wells near a town: Amarillo · Newest drilling permits in Potter County · Wells by ZIP code
Potter County reported 7.8 million mcf of gas and 183,543 barrels of oil in the last 12 months. That ranks 80th of 197 Texas counties by gas.
County dossier
August 2026 is still coming in. About 89% of Texas leases have reported it so far, so this page counts through July 2026 until it is fully reported.
- Producing leases
- 525of 659 on record
- Operators
- 13
- Fields
- 11
- Top operator
- Burk Royalty Co., Ltd.
Own minerals in Potter County?
A family member owned minerals here?
Search their name: a family member who owned minerals hereWhere it sits
This county
- Oil, last 12 months
- 183,543 bbl
- Share of Texas gas
- <0.1%
- Wells on record
- 1,358on leases with production reports
- Data through
- Jul 2026
Five years of output in Potter County
Gas output in Potter County fell 31% over the last 12 months
7.8M mcf through Jul 2026, against 11M mcf a year earlier. Peak Aug 2024: 1M mcf.
Oil output in Potter County fell 11% over the last 12 months
184k bbl through Jul 2026, against 206k bbl a year earlier. Peak Aug 2021: 34.4k bbl.
SourceTexas Railroad Commission Production Data Query, county totals, through Jul 2026, file dated Oct 20, 2026.
Cite or embed this chart
Free to use for Potter County, Texas, with a credit and a link. Copy what you need.
Credit line
Source: Royalty Clerk analysis of Texas Railroad Commission filings, https://royaltyclerk.com/texas/counties/potter-county-tx, data to July 2026.
The chart on your own page
Free to embed on any site. Keep the “Source: Royalty Clerk” link under the chart.
See the code
<iframe
  src="https://royaltyclerk.com/embed/counties/potter-county-tx"
  title="Royalty Clerk: oil and gas production, Potter County, Texas"
  width="100%"
  height="400"
  style="border:0"
  loading="lazy"></iframe>
<p style="margin:4px 0 0;font-size:14px">Source: <a href="https://royaltyclerk.com/texas/counties/potter-county-tx" target="_blank">Royalty Clerk</a></p>
<script>
window.addEventListener("message", function (e) {
  if (e.origin !== "https://royaltyclerk.com" || !e.data || e.data.type !== "rc-embed-height") return;
  var frames = document.getElementsByTagName("iframe");
  for (var i = 0; i < frames.length; i++) {
    if (frames[i].contentWindow === e.source && e.data.height > 0) frames[i].style.height = Number(e.data.height) + "px";
  }
});
</script>
Potter County oil and gas production by year, 1993 to 2025
Every full year we hold, 1993 to 2025. The highest year for oil since 1993 was 2018, at 1,115,091 bbl. The highest year for gas was 1994, at 35,995,271 mcf.
| Year | Oilbbl | Gasmcf |
|---|---|---|
| 2025 | 189,213 | 10,397,766 |
| 2024 | 232,011 | 9,941,011 |
| 2023 | 270,898 | 8,714,216 |
| 2022 | 318,922 | 9,202,406 |
| 2021 | 361,370 | 9,533,982 |
| 2020 | 449,968 | 10,663,415 |
| 2019 | 826,107 | 10,663,335 |
| 2018 | 1,115,091 | 8,867,211 |
| 2017 | 859,008 | 9,202,766 |
| 2016 | 666,242 | 10,513,737 |
| 2015 | 1,107,527 | 11,495,844 |
| 2014 | 321,894 | 9,372,941 |
| 2013 | 174,214 | 9,385,890 |
| 2012 | 162,415 | 10,596,972 |
| 2011 | 151,410 | 11,569,962 |
| 2010 | 144,549 | 12,318,896 |
| 2009 | 161,610 | 13,454,651 |
| 2008 | 205,672 | 15,209,888 |
| 2007 | 173,423 | 16,745,854 |
| 2006 | 175,792 | 18,214,378 |
| 2005 | 144,726 | 16,580,673 |
| 2004 | 143,327 | 19,761,771 |
| 2003 | 137,669 | 19,264,020 |
| 2002 | 163,555 | 19,911,175 |
| 2001 | 207,013 | 22,438,660 |
| 2000 | 292,868 | 25,233,045 |
| 1999 | 223,714 | 26,724,230 |
| 1998 | 227,686 | 29,184,854 |
| 1997 | 242,208 | 28,726,848 |
| 1996 | 343,125 | 29,121,081 |
| 1995 | 359,071 | 32,964,822 |
| 1994 | 268,519 | 35,995,271 |
| 1993 | 276,679 | 35,502,379 |
SourceTexas Railroad Commission production records, added up by county and calendar year. Oil includes condensate; gas includes casinghead gas. The year in progress is left out until it is complete.
The biggest leases in Potter County
Under each volume: change on the year before.
37,826bbl oil−12%
34,017bbl oil−3%
19,927bbl oil−8%
9,916bbl oil−6%
9,504bbl oil−13%
7,156bbl oil+377%
6,635bbl oil+13%
5,746bbl oil−43%
117,884mcf gas−22%
4,667bbl oil+13%
96,835mcf gas−2%
3,617bbl oil+44%
3,283bbl oil+51%
74,053mcf gas+28%
3,129bbl oil+16%
70,032mcf gas+4%
2,971bbl oil−43%
2,915bbl oil−28%
2,764bbl oil+15%
63,402mcf gas−36%
62,942mcf gas−26%
62,479mcf gas−8%
62,207mcf gas−28%
2,591bbl oil−19%
58,200mcf gas+45%
Showing 25 of 150 (the 150 largest of 525), ranked by output value.
SourceTexas Railroad Commission Production Data Query.
Who runs the leases, and what they produce
Operators in Potter County, by gas
Burk Royalty Co. leads
- Burk Royalty Co., Ltd.467 leases4.6Mmcf
- Presidio Petroleum LLC21 leases1.7Mmcf
- High River Res Operating, LLC23 leases337kmcf
- Berexco LLC1 lease69.6kmcf
- Pantera Energy Company2 leases13.5kmcf
- Ponderosa TX Operating LLC2 leases9,309mcf
- Sunlight Exploration, Inc.2 leases3,809mcf
- LDX Operating Company, Llc.1 lease672mcf
Fields in Potter County, by gas
Panhandle, West leads
- Panhandle, West277 leases · District 10 · Field 688310013.9Mmcf
- Bivins Lit (Canyon Lime)10 leases · District 10 · Field 084907501.6Mmcf
- Panhandle, West (Red Cave)215 leases · District 10 · Field 688312001.1Mmcf
- Amarillo, North (Canyon Lime)10 leases · District 10 · Field 0225250077.3kmcf
- Panhandle (Red Cave)4 leases · District 10 · Field 6882580069.6kmcf
- Bivins Ranch (Missourian Wash)1 lease · District 10 · Field 084925753,809mcf
- Bivins Lit (Wolfcamp)1 lease · District 10 · Field 084908502,296mcf
- Cruz Creek (Brown Dolomite)2 leases · District 10 · Field 22078100672mcf
More operators here
Recent drilling permits in Potter County
MASTERSON G #7318
new drill · Berexco LLC · Potter County
Permit 0919760 · Oct 29, 2026
BIVINS #3902N
new drill · horizontal · King Operating Corporation · Potter County
Permit 0918784 · Sep 24, 2026
BIVINS #3901S
new drill · horizontal · King Operating Corporation · Potter County
Permit 0918706 · Sep 22, 2026
EXELL RANCH 'A' #5401
new drill · Sunlight Exploration, Inc. · Potter County
Permit 0916828 · Jul 8, 2026
MASTERSON G #7317
new drill · Berexco LLC · Potter County
Permit 0915765 · May 29, 2026
BIVINS #1042N
new drill · horizontal · King Operating Corporation · Potter County
Permit 0911513 · Nov 7, 2025