
Texas county · RRC district 7C
Schleicher County, Texas oil and gas
- 3,559,388mcf gas in the last 12 months
- 773producing leases
- 1,485wells on the map
- 10drilling locations in two years
The story
Upp Operating took over Schleicher County's leases in 2019
Gas made a little over three quarters of the county's output in the last 12 months, 79.9%. Oil in the last 12 months is about a fifth of 1993, the full calendar year that produced the most oil: 21.3%.
The operators have changed often. Highmount Expl & Prod Texas LLC led from 2008, after taking 184 leases from Dominion Oklahoma Texas E&P, Inc. Enervest Operating, L.L.C. took 378 leases from Highmount in 2014. Upp Operating, LLC took 377 leases from Enervest in 2019 and has led since. It reported 40.8% of output in the last 12 months.
Hilcorp Energy Company took 90 leases from OXY USA Inc. in 2026. Drilling is active: 7 permits in the last 12 months came from 6 operators, and none are for horizontal wells.
Not a forecast, not reserves.
Key moments
- 1993Biggest full calendar year: 700,926 barrels of oil and 18,120,918 mcf gas.
- 2001Dominion Oklahoma Texas E&P takes 111 leases from Dreyfus.
- 2008Highmount Expl & Prod Texas LLC takes 184 leases from Dominion.
- 2014Enervest Operating takes 378 leases from Highmount.
- 2019Upp Operating takes 377 leases from Enervest Operating.
- 2026Hilcorp Energy takes 90 leases from OXY USA.
Oil wells and drilling locations in Schleicher County
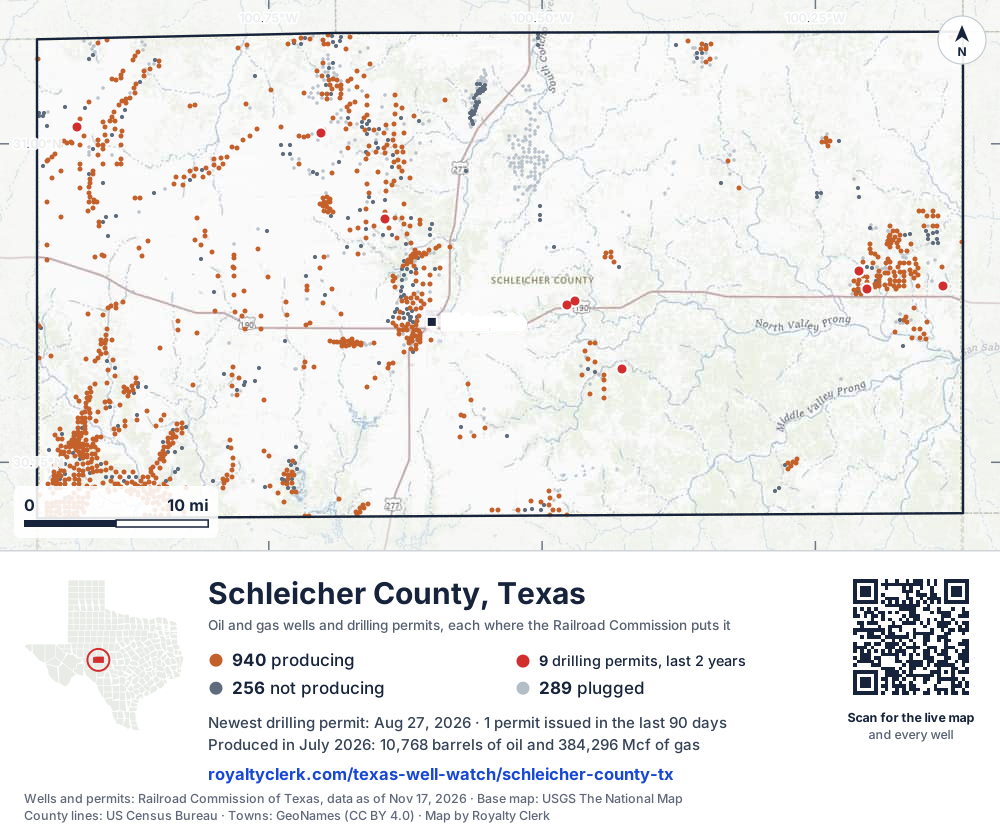
- Drilling locations10Permits issued in the last two years
- Producing wells940On a lease reporting production now
- Not producing257Shut in, inactive or no lease on record
- Plugged288The state's wellbore record says plugged
Sources: Railroad Commission of Texas well layers and permit files, US Census Bureau county outline, town points from GeoNames (CC BY 4.0), base map from USGS The National Map. A dot is a surface location; a horizontal well runs a mile or more from it.
1,485 wells with a location on the state's map (940 producing, 257 not producing, 288 plugged) and 10 drilling locations permitted in the last 24 months, each where the Railroad Commission puts it.
Use this map on your site
You may show this map on any site, unchanged. Keep the credit line and its link to Royalty Clerk under the map. The picture updates by itself as the state records new wells and permits.
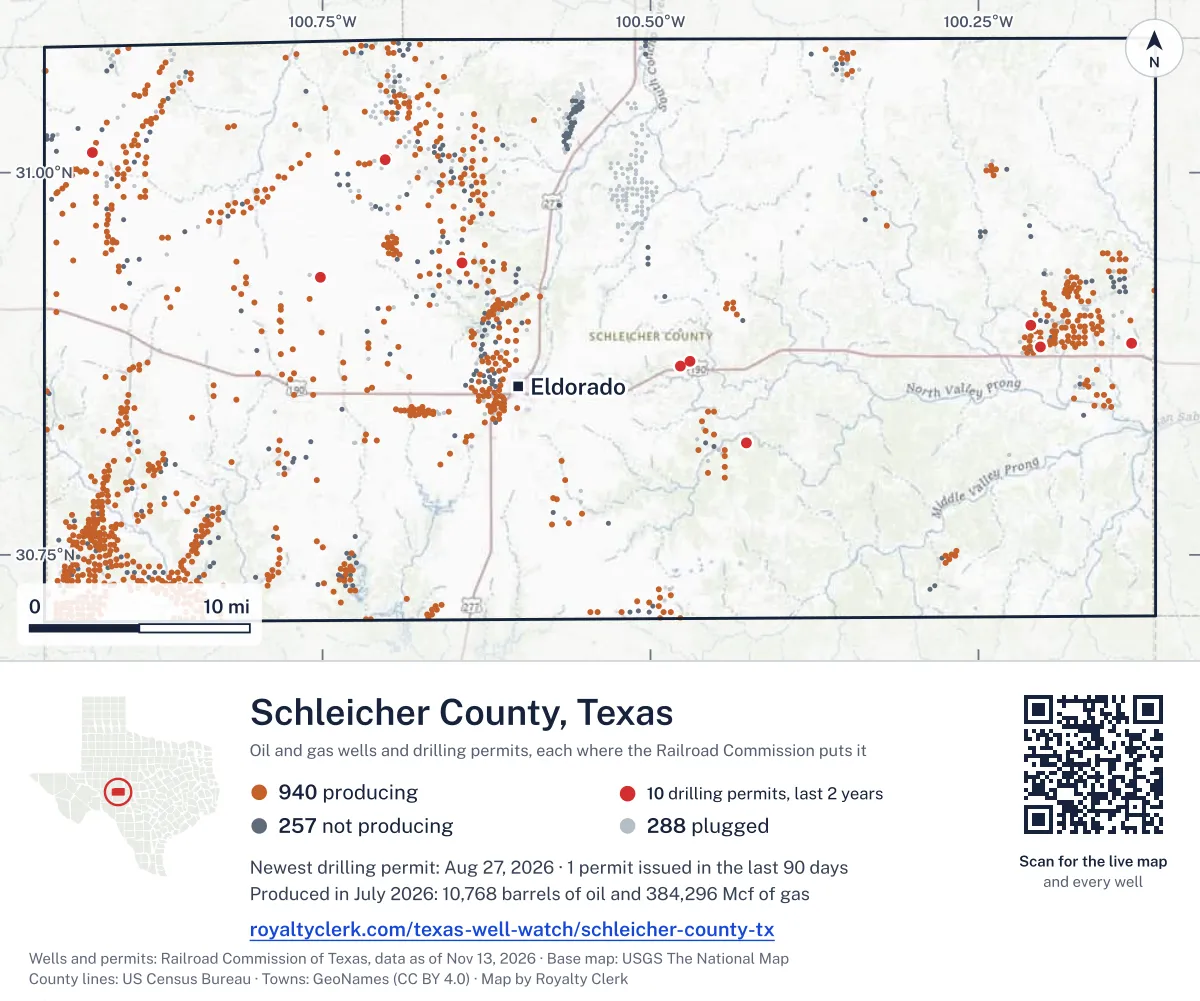
<a href="https://royaltyclerk.com/texas/counties/schleicher-county-tx"><img src="https://royaltyclerk.com/maps/county-wells/schleicher-county-tx.svg" alt="Map of Schleicher County, Texas, with 1,485 oil and gas wells and 10 recent drilling locations as dots." width="1000" height="834" loading="lazy" style="max-width:100%;height:auto;border:0"></a>
<p style="margin:4px 0 0;font-size:14px">Map: <a href="https://royaltyclerk.com/texas/counties/schleicher-county-tx">Schleicher County, Texas oil and gas wells</a> by Royalty Clerk, from Railroad Commission of Texas records</p>
Wells near a town: Eldorado · Newest drilling permits in Schleicher County · Wells by ZIP code
Schleicher County is one of the 61 counties of the Permian Basin
Schleicher County reported 3.6 million mcf of gas and 149,413 barrels of oil in the last 12 months. That ranks 111th of 197 Texas counties by gas.
County dossier
August 2026 is still coming in. About 89% of Texas leases have reported it so far, so this page counts through July 2026 until it is fully reported.
- Producing leases
- 773of 1,103 on record
- Operators
- 54
- Fields
- 99
- Top operator
- Upp Operating, LLC
Own minerals in Schleicher County?
A family member owned minerals here?
Search their name: a family member who owned minerals hereWhere it sits
This county
- Oil, last 12 months
- 149,413 bbl
- Share of Texas gas
- <0.1%
- Wells on record
- 1,485on leases with production reports
- Data through
- Jul 2026
If you own here
- Mineral interest finder
18 leases here carry estate, heirs or trust names; search a name for its accounts and leases.
- Find the land on my deed
The county has 1,103 leases on record; find your section, block or abstract on the survey map.
- Royalty calculator
773 leases are producing here and gas made 79.9% of output; enter your figures for an estimated check.
Questions owners ask
- Who runs the leases in Schleicher County now?
- Upp Operating, LLC has led the county since 2019, when it took 377 leases from Enervest Operating, L.L.C. It reported 40.8% of the county's oil and gas in barrels of oil equivalent in the last 12 months. The 3 biggest operators reported 57.8% together.
- How much of the county's output is gas?
- Gas made more of the county's output than oil in every full calendar year from 1993 to 2025. In the last 12 months gas made a little over three quarters of output, counted in barrels of oil equivalent: 79.9%.
- Has the number of operators here changed?
- Yes. In 2025, 74 operators filed reports here, against 130 in 1993, the most of any full calendar year: more than half as many. Hilcorp Energy Company took 90 leases from OXY USA Inc. in 2026.
- Are new drilling permits being filed here?
- Yes. The state shows 7 drilling permits in the last 12 months, from 6 operators, against 4 in the 12 months before. None are for horizontal wells. Oil Projects, LLC filed 2 of them.
- Do some leases here carry estate, heir or trust names?
- The state counts 18 leases here with an estate, heirs or trust name on them. This page shows county totals only and names no lease or owner. A name search can find the accounts and leases tied to it. Mineral interest finder
Related pages
- Upp Operating, LLC
Largest operator here: 328 producing leases and 40.8% of output.
- TXP, Incorporated
Took 37 leases in 24 months; 53 producing leases now.
- Discovery Operating, Inc.
Led the county in 1993 with 58 leases; 55 producing now.
- Sawyer (Canyon)
Top field here: 223 producing leases now.
- Ozona, Ne. (Canyon 7520)
Second field: 127 producing leases now.
From the state's records through July 2026.
Schleicher County oil and gas, the last five years
Gas output in Schleicher County fell 14% over the last 12 months
3.6M mcf through Jul 2026, against 4.1M mcf a year earlier. Peak Jan 2022: 612k mcf.
Oil output in Schleicher County fell 17% over the last 12 months
149k bbl through Jul 2026, against 180k bbl a year earlier. Peak Dec 2021: 22.1k bbl.
SourceTexas Railroad Commission Production Data Query, county totals, through Jul 2026, file dated Oct 20, 2026.
Cite or embed this chart
Free to use for Schleicher County, Texas, with a credit and a link. Copy what you need.
Credit line
Source: Royalty Clerk analysis of Texas Railroad Commission filings, https://royaltyclerk.com/texas/counties/schleicher-county-tx, data to July 2026.
The chart on your own page
Free to embed on any site. Keep the “Source: Royalty Clerk” link under the chart.
See the code
<iframe
  src="https://royaltyclerk.com/embed/counties/schleicher-county-tx"
  title="Royalty Clerk: oil and gas production, Schleicher County, Texas"
  width="100%"
  height="400"
  style="border:0"
  loading="lazy"></iframe>
<p style="margin:4px 0 0;font-size:14px">Source: <a href="https://royaltyclerk.com/texas/counties/schleicher-county-tx" target="_blank">Royalty Clerk</a></p>
<script>
window.addEventListener("message", function (e) {
  if (e.origin !== "https://royaltyclerk.com" || !e.data || e.data.type !== "rc-embed-height") return;
  var frames = document.getElementsByTagName("iframe");
  for (var i = 0; i < frames.length; i++) {
    if (frames[i].contentWindow === e.source && e.data.height > 0) frames[i].style.height = Number(e.data.height) + "px";
  }
});
</script>
How oil and gas changed year by year
Every full year we hold, 1993 to 2025. The highest year for oil since 1993 was 1993, at 700,926 bbl. The highest year for gas was 1993, at 18,120,918 mcf.
| Year | Oilbbl | Gasmcf |
|---|---|---|
| 2025 | 169,003 | 3,886,101 |
| 2024 | 193,298 | 4,227,891 |
| 2023 | 212,409 | 4,923,553 |
| 2022 | 226,400 | 5,369,160 |
| 2021 | 252,576 | 5,510,846 |
| 2020 | 248,006 | 5,993,777 |
| 2019 | 304,459 | 6,654,739 |
| 2018 | 347,551 | 7,691,038 |
| 2017 | 412,283 | 8,314,921 |
| 2016 | 486,765 | 9,633,901 |
| 2015 | 520,280 | 10,558,086 |
| 2014 | 608,958 | 11,974,890 |
| 2013 | 536,937 | 11,056,409 |
| 2012 | 506,218 | 13,392,357 |
| 2011 | 491,815 | 15,052,640 |
| 2010 | 456,205 | 13,731,450 |
| 2009 | 458,406 | 13,020,088 |
| 2008 | 476,801 | 13,273,765 |
| 2007 | 478,406 | 14,549,917 |
| 2006 | 451,161 | 15,658,638 |
| 2005 | 440,609 | 12,675,690 |
| 2004 | 463,629 | 10,797,535 |
| 2003 | 531,363 | 11,210,434 |
| 2002 | 545,237 | 12,021,296 |
| 2001 | 541,870 | 12,105,509 |
| 2000 | 596,636 | 12,210,772 |
| 1999 | 553,511 | 12,103,558 |
| 1998 | 600,233 | 12,696,686 |
| 1997 | 632,412 | 13,387,677 |
| 1996 | 637,928 | 15,513,194 |
| 1995 | 669,877 | 17,817,308 |
| 1994 | 632,841 | 16,721,214 |
| 1993 | 700,926 | 18,120,918 |
SourceTexas Railroad Commission production records, added up by county and calendar year. Oil includes condensate; gas includes casinghead gas. The year in progress is left out until it is complete.
Which leases produce the most here now
Under each volume: change on the year before.
10,033bbl oil+5%
6,595bbl oil+108%
5,331bbl oil−23%
5,324bbl oil−2%
5,088bbl oil−16%
4,966bbl oil+7%
4,860bbl oil+1%
3,933bbl oil−36%
3,839bbl oil−5%
3,264bbl oil−17%
3,179bbl oil+23%
2,646bbl oil−7%
2,599bbl oil−11%
2,547bbl oil+12%
2,461bbl oil−46%
57,325mcf gas−10%
2,403bbl oil−73%
2,287bbl oil−18%
2,201bbl oil−7%
2,120bbl oil−31%
1,970bbl oil+1%
1,874bbl oil−16%
1,862bbl oil−17%
1,670bbl oil−18%
1,643bbl oil−25%
Showing 25 of 150 (the 150 largest of 773), ranked by output value.
SourceTexas Railroad Commission Production Data Query.
Who runs the leases, and what they produce
Operators in Schleicher County, by gas
Which operators produce the most in Schleicher County now
Fields in Schleicher County, by gas
Which fields produce the most here now
- Sawyer (Canyon)223 leases · District 7C · Field 81267333846kmcf
- Ozona, Ne. (Canyon 7520)127 leases · District 7C · Field 67998500710kmcf
- Spraberry (Trend Area)4 leases · District 7C · Field 85279200404kmcf
- Cody Bell (Canyon)46 leases · District 7C · Field 19303180193kmcf
- Sawyer (Strawn, North)23 leases · District 7C · Field 81267691172kmcf
- Cody Bell, SW. (Wolfcamp)4 leases · District 7C · Field 1931088881.3kmcf
- Page5 leases · District 7C · Field 6834900121.6kmcf
- Camar, SW. (Strawn)4 leases · District 7C · Field 1498825019.2kmcf
More operators here
How many drilling permits were filed recently
WHEELER #1DF
new drill · DRY Fork Production Co., LLC · Schleicher County
Permit 0918125 · Aug 27, 2026
HOUSTON #1
new drill · Reatta Energy, Inc. · Schleicher County
Permit 0912526 · Apr 7, 2026
WHITTEN, L.I. #1
recompletion · TXP, Incorporated · Schleicher County
Permit 0913577 · Feb 20, 2026
THORNBURG #T 1A
recompletion · Oil Projects, LLC · Schleicher County
Permit 0912586 · Jan 9, 2026
SIMMONS #2
new drill · VX Operating, LLC · Schleicher County
Permit 0911210 · Oct 20, 2025
UNIVERSITY 5 #1
recompletion · Bustamante Oil Company · Schleicher County
Permit 0911167 · Oct 17, 2025