
Texas county · RRC district 04
Hidalgo County, Texas oil and gas
- 21,798,865mcf gas in the last 12 months
- 949producing leases
- 1,732wells on the map
- 5drilling locations in two years
Oil wells and drilling locations in Hidalgo County
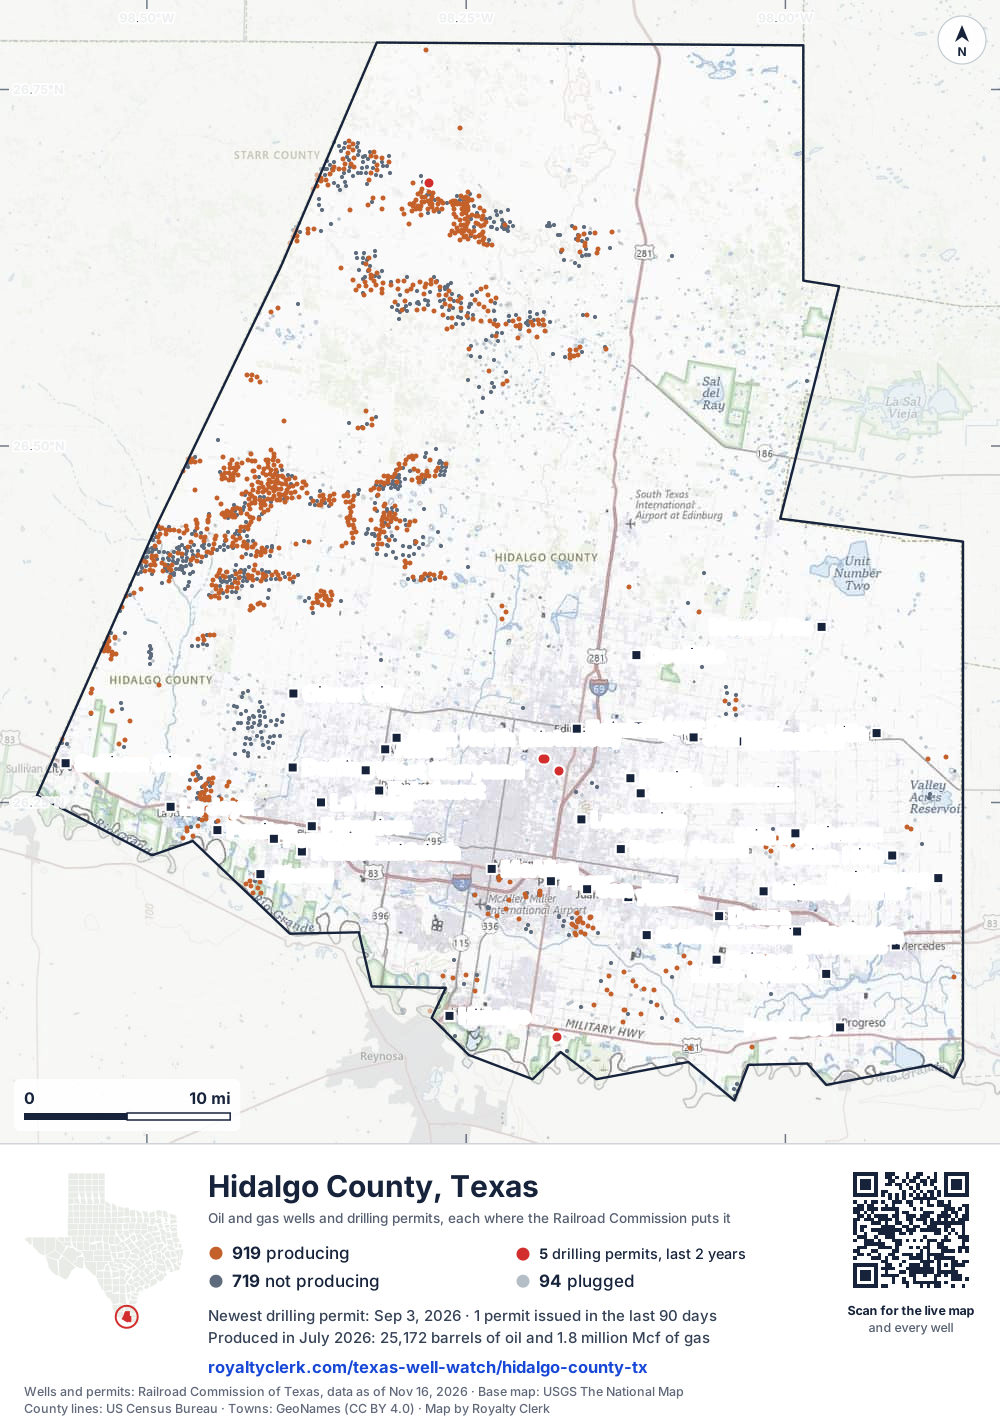
- Drilling locations5Permits issued in the last two years
- Producing wells919On a lease reporting production now
- Not producing719Shut in, inactive or no lease on record
- Plugged94The state's wellbore record says plugged
Sources: Railroad Commission of Texas well layers and permit files, US Census Bureau county outline, town points from GeoNames (CC BY 4.0), base map from USGS The National Map. A dot is a surface location; a horizontal well runs a mile or more from it.
1,732 wells with a location on the state's map (919 producing, 719 not producing, 94 plugged) and 5 drilling locations permitted in the last 24 months, each where the Railroad Commission puts it.
Use this map on your site
You may show this map on any site, unchanged. Keep the credit line and its link to Royalty Clerk under the map. The picture updates by itself as the state records new wells and permits.
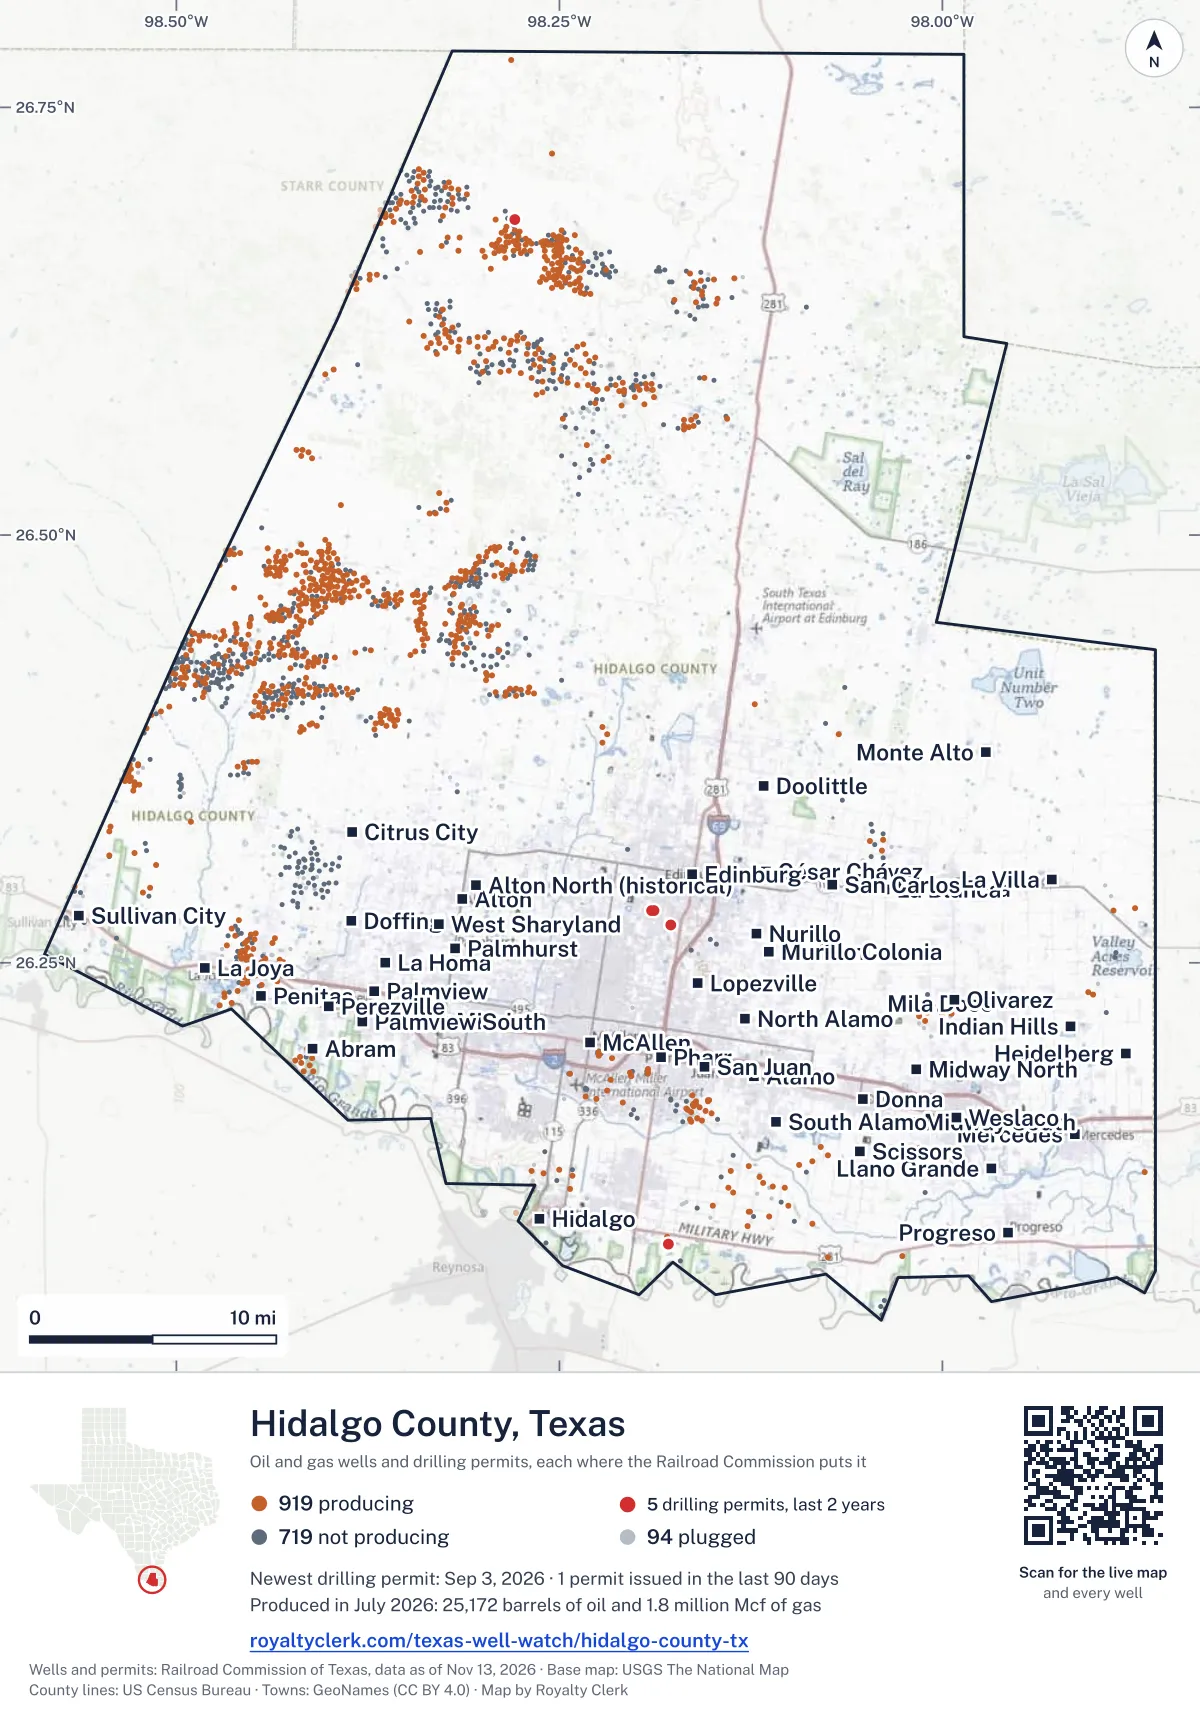
<a href="https://royaltyclerk.com/texas/counties/hidalgo-county-tx"><img src="https://royaltyclerk.com/maps/county-wells/hidalgo-county-tx.svg" alt="Map of Hidalgo County, Texas, with 1,732 oil and gas wells and 5 recent drilling locations as dots." width="1000" height="1427" loading="lazy" style="max-width:100%;height:auto;border:0"></a>
<p style="margin:4px 0 0;font-size:14px">Map: <a href="https://royaltyclerk.com/texas/counties/hidalgo-county-tx">Hidalgo County, Texas oil and gas wells</a> by Royalty Clerk, from Railroad Commission of Texas records</p>
Wells near a town: Abram · Alamo · Alton · Alton North (historical) · César Chávez · Citrus City · Doffing · Donna · Doolittle · Edcouch · Edinburg · Elsa · Heidelberg · Hidalgo · Indian Hills · La Blanca · La Homa · La Joya · La Villa · Llano Grande · Lopezville · McAllen · Mercedes · Midway North · Midway South · Mila Doce · Mission · Monte Alto · Muniz · Murillo Colonia · North Alamo · Nurillo · Olivarez · Palmhurst · Palmview · Palmview South · Penitas · Perezville · Pharr · Progreso · San Carlos · San Juan · Scissors · South Alamo · Sullivan City · Weslaco · West Sharyland · Newest drilling permits in Hidalgo County · Wells by ZIP code
Hidalgo County reported 22 million mcf of gas and 299,118 barrels of oil in the last 12 months. That ranks 56th of 197 Texas counties by gas.
County dossier
August 2026 is still coming in. About 89% of Texas leases have reported it so far, so this page counts through July 2026 until it is fully reported.
- Producing leases
- 949of 1,821 on record
- Operators
- 29
- Fields
- 146
- Top operator
- Merit Energy Company
Own minerals in Hidalgo County?
A family member owned minerals here?
Search their name: a family member who owned minerals hereWhere it sits
This county
- Oil, last 12 months
- 299,118 bbl
- Share of Texas gas
- 0.2%
- Wells on record
- 1,751on leases with production reports
- Data through
- Jul 2026
Five years of output in Hidalgo County
Gas output in Hidalgo County fell 9% over the last 12 months
22M mcf through Jul 2026, against 24M mcf a year earlier. Peak Oct 2021: 3.1M mcf.
Oil output in Hidalgo County fell 10% over the last 12 months
299k bbl through Jul 2026, against 331k bbl a year earlier. Peak Oct 2021: 40.2k bbl.
SourceTexas Railroad Commission Production Data Query, county totals, through Jul 2026, file dated Oct 20, 2026.
Cite or embed this chart
Free to use for Hidalgo County, Texas, with a credit and a link. Copy what you need.
Credit line
Source: Royalty Clerk analysis of Texas Railroad Commission filings, https://royaltyclerk.com/texas/counties/hidalgo-county-tx, data to July 2026.
The chart on your own page
Free to embed on any site. Keep the “Source: Royalty Clerk” link under the chart.
See the code
<iframe
  src="https://royaltyclerk.com/embed/counties/hidalgo-county-tx"
  title="Royalty Clerk: oil and gas production, Hidalgo County, Texas"
  width="100%"
  height="400"
  style="border:0"
  loading="lazy"></iframe>
<p style="margin:4px 0 0;font-size:14px">Source: <a href="https://royaltyclerk.com/texas/counties/hidalgo-county-tx" target="_blank">Royalty Clerk</a></p>
<script>
window.addEventListener("message", function (e) {
  if (e.origin !== "https://royaltyclerk.com" || !e.data || e.data.type !== "rc-embed-height") return;
  var frames = document.getElementsByTagName("iframe");
  for (var i = 0; i < frames.length; i++) {
    if (frames[i].contentWindow === e.source && e.data.height > 0) frames[i].style.height = Number(e.data.height) + "px";
  }
});
</script>
Hidalgo County oil and gas production by year, 1993 to 2025
Every full year we hold, 1993 to 2025. The highest year for oil since 1993 was 1998, at 4,421,458 bbl. The highest year for gas was 2001, at 324,499,299 mcf.
| Year | Oilbbl | Gasmcf |
|---|---|---|
| 2025 | 315,801 | 23,233,929 |
| 2024 | 356,066 | 25,005,492 |
| 2023 | 389,225 | 26,790,982 |
| 2022 | 431,309 | 30,611,285 |
| 2021 | 493,513 | 35,960,556 |
| 2020 | 538,341 | 40,913,797 |
| 2019 | 679,580 | 48,163,282 |
| 2018 | 767,624 | 52,836,355 |
| 2017 | 812,207 | 57,966,443 |
| 2016 | 950,575 | 68,178,332 |
| 2015 | 1,219,891 | 82,233,188 |
| 2014 | 1,534,725 | 95,421,674 |
| 2013 | 1,474,313 | 98,095,579 |
| 2012 | 1,434,436 | 104,971,030 |
| 2011 | 1,691,050 | 123,572,839 |
| 2010 | 2,097,483 | 152,530,797 |
| 2009 | 2,672,685 | 186,052,775 |
| 2008 | 3,204,763 | 245,261,790 |
| 2007 | 3,365,114 | 246,553,711 |
| 2006 | 2,625,572 | 207,989,340 |
| 2005 | 2,845,051 | 210,493,173 |
| 2004 | 2,839,768 | 234,342,884 |
| 2003 | 3,617,918 | 284,805,810 |
| 2002 | 3,988,584 | 311,563,930 |
| 2001 | 4,162,031 | 324,499,299 |
| 2000 | 3,996,705 | 295,251,751 |
| 1999 | 4,131,059 | 277,607,199 |
| 1998 | 4,421,458 | 285,070,283 |
| 1997 | 3,748,655 | 280,329,657 |
| 1996 | 3,156,461 | 236,153,189 |
| 1995 | 2,990,644 | 212,190,932 |
| 1994 | 3,004,729 | 201,840,600 |
| 1993 | 3,272,684 | 212,483,293 |
SourceTexas Railroad Commission production records, added up by county and calendar year. Oil includes condensate; gas includes casinghead gas. The year in progress is left out until it is complete.
Hidalgo County appraisal district, 2026 mineral roll
Mineral owners in Hidalgo County: 51,077 royalty records on the roll
At least 766 of the 51,077 royalty-interest records on Hidalgo County's 2026 mineral roll are still titled to an estate (1.50%). We publish counts only. No owner’s name or address is on this page; to look for one family, search its name.
- Royalty-interest records, 2026 roll
- 51,077
- Still titled to an estate, at least
- 766
- Share of the roll
- 1.50%
SourceRoyalty Clerk count of the Hidalgo County mineral appraisal roll of 2026, read November 2026. A record is one line of the roll, not one person.
The biggest leases in Hidalgo County
Under each volume: change on the year before.
1,032,717mcf gasn/a
342,254mcf gas+243%
331,326mcf gas+1%
267,171mcf gas0%
210,741mcf gas+44%
207,589mcf gas+7%
200,543mcf gas−7%
188,577mcf gas−15%
183,582mcf gas−52%
153,830mcf gas−31%
153,495mcf gas−2%
141,319mcf gasn/a
5,828bbl oil−28%
129,517mcf gas+222%
128,714mcf gas+9%
122,509mcf gas−11%
122,337mcf gas−3%
121,382mcf gas−24%
121,225mcf gas−19%
119,766mcf gas+216%
114,829mcf gas+8%
109,664mcf gas−18%
108,650mcf gas+17%
108,063mcf gas−19%
107,591mcf gas−25%
Showing 25 of 150 (the 150 largest of 949), ranked by output value.
SourceTexas Railroad Commission Production Data Query.
Who runs the leases, and what they produce
Operators in Hidalgo County, by gas
Merit Energy leads
- Merit Energy Company637 leases14Mmcf
- Hilcorp Energy Company118 leases3Mmcf
- Royal Production Company, Inc.5 leases1.4Mmcf
- Dewbre Petroleum Corporation54 leases1.1Mmcf
- STX Operating Company17 leases491kmcf
- Mountain V Texas, LLC12 leases241kmcf
- Proline Energy Resources Inc18 leases193kmcf
- Capital Star Oil & Gas, Inc.15 leases182kmcf
Fields in Hidalgo County, by gas
Javelina (Vicksburg Cons.) leads
- Javelina (Vicksburg Cons.)179 leases · District 04 · Field 458410505.6Mmcf
- McAllen Ranch (Vksbg L-V, N Cons116 leases · District 04 · Field 587421581.9Mmcf
- McAllen-Pharr (Consolidated)44 leases · District 04 · Field 587495001.5Mmcf
- Edinburg (8800)2 leases · District 04 · Field 276083051.2Mmcf
- McAllen Ranch (Vksbg P-V,S Cons)52 leases · District 04 · Field 58742342887kmcf
- Tabasco (Consolidated)40 leases · District 04 · Field 88103100861kmcf
- McCook, Se (Vicksburg Deep)13 leases · District 04 · Field 59083700841kmcf
- Flores (Vicksburg, Lower)22 leases · District 04 · Field 31533500367kmcf
More operators here
Recent drilling permits in Hidalgo County
EDINBURG UNIT #10
recompletion · Royal Production Company, Inc. · Hidalgo County
Permit 0918203 · Sep 3, 2026
MCALLEN, A. A. #109
recompletion · Merit Energy Company · Hidalgo County
Permit 0916390 · Jun 29, 2026
MARY BELL DOFFING GAS UNIT #2
new drill · Midas Resources, Inc. · Hidalgo County
Permit 0909254 · Jul 16, 2025
EDINBURG UNIT #7
recompletion · Royal Production Company, Inc. · Hidalgo County
Permit 0908132 · Jun 5, 2025
EDINBURG GAS UNIT #12
recompletion · Royal Production Company, Inc. · Hidalgo County
Permit 0904887 · Dec 31, 2024
WOODS CHRISTIAN #42
recompletion · Merit Energy Company · Hidalgo County
Permit 0896922 · Apr 15, 2024