
Texas county · RRC district 06
Upshur County, Texas oil and gas
- 22,371,292mcf gas in the last 12 months
- 589producing leases
- 982wells on the map
- 10drilling locations in two years
Oil wells and drilling locations in Upshur County
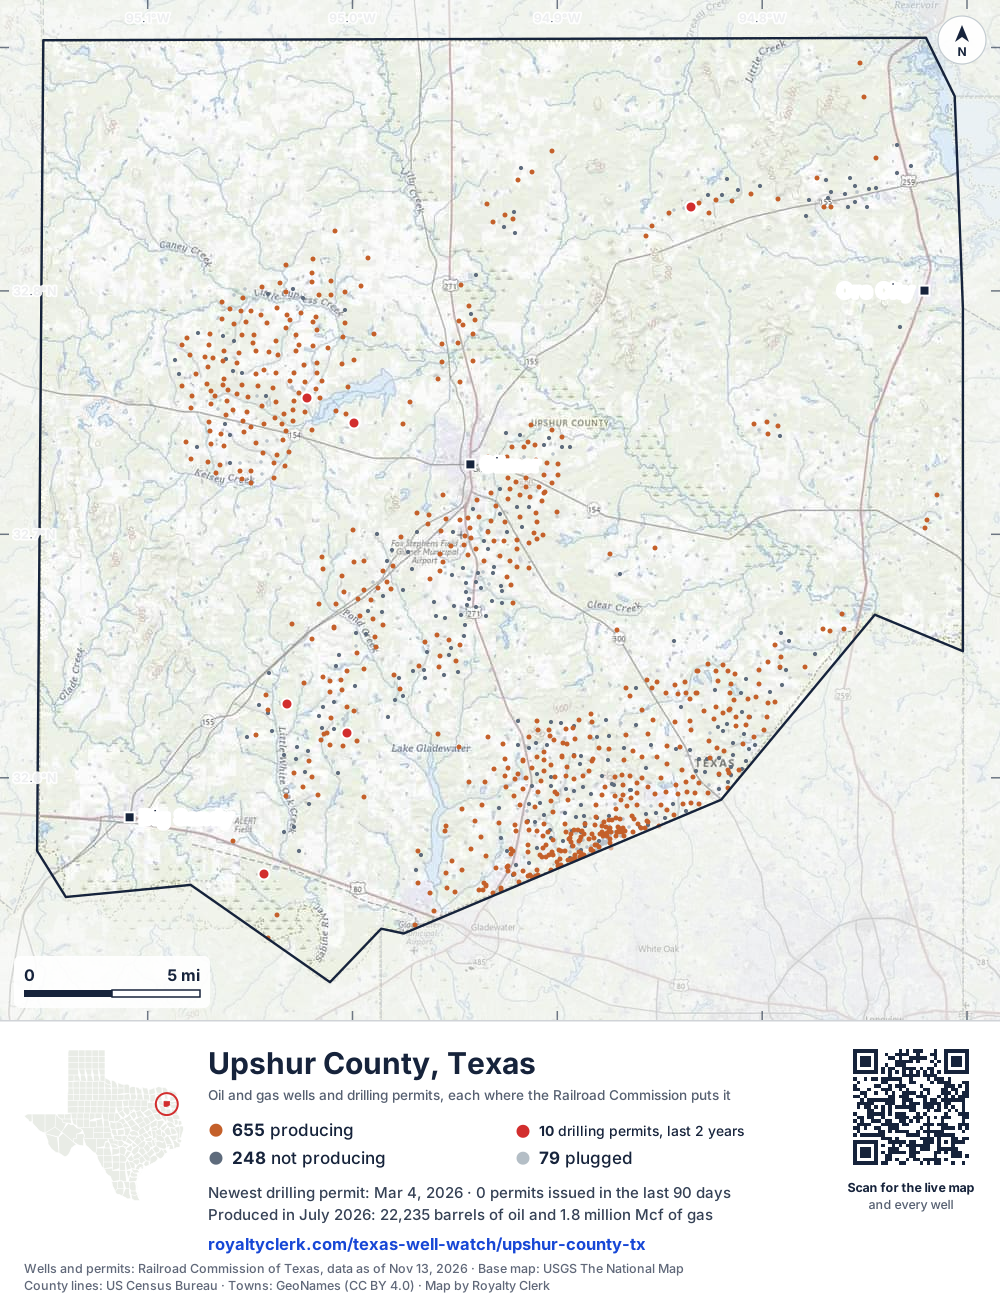
- Drilling locations10Permits issued in the last two years
- Producing wells655On a lease reporting production now
- Not producing248Shut in, inactive or no lease on record
- Plugged79The state's wellbore record says plugged
Sources: Railroad Commission of Texas well layers and permit files, US Census Bureau county outline, town points from GeoNames (CC BY 4.0), base map from USGS The National Map. A dot is a surface location; a horizontal well runs a mile or more from it.
982 wells with a location on the state's map (655 producing, 248 not producing, 79 plugged) and 10 drilling locations permitted in the last 24 months, each where the Railroad Commission puts it.
Use this map on your site
You may show this map on any site, unchanged. Keep the credit line and its link to Royalty Clerk under the map. The picture updates by itself as the state records new wells and permits.
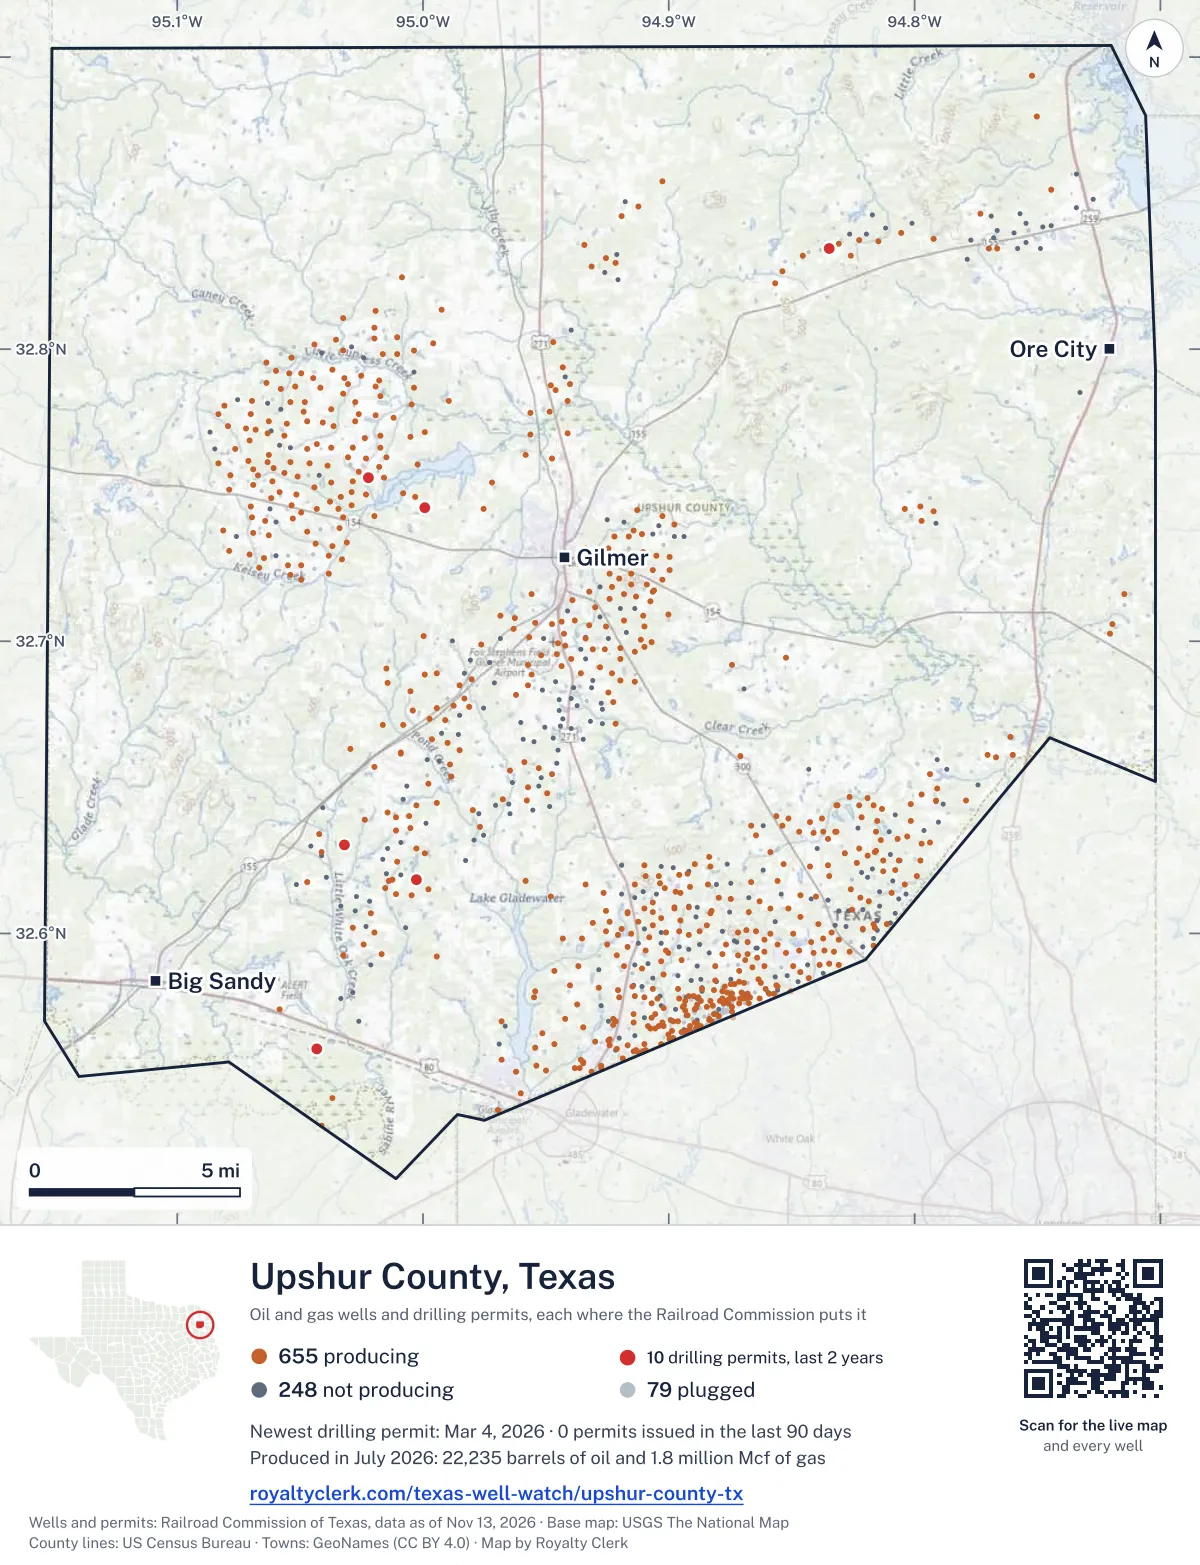
<a href="https://royaltyclerk.com/texas/counties/upshur-county-tx"><img src="https://royaltyclerk.com/maps/county-wells/upshur-county-tx.svg" alt="Map of Upshur County, Texas, with 982 oil and gas wells and 10 recent drilling locations as dots." width="1000" height="1304" loading="lazy" style="max-width:100%;height:auto;border:0"></a>
<p style="margin:4px 0 0;font-size:14px">Map: <a href="https://royaltyclerk.com/texas/counties/upshur-county-tx">Upshur County, Texas oil and gas wells</a> by Royalty Clerk, from Railroad Commission of Texas records</p>
Wells near a town: Big Sandy · Gilmer · Ore City · Newest drilling permits in Upshur County · Wells by ZIP code
Upshur County reported 22 million mcf of gas and 266,094 barrels of oil in the last 12 months. That ranks 53rd of 197 Texas counties by gas.
County dossier
August 2026 is still coming in. About 89% of Texas leases have reported it so far, so this page counts through July 2026 until it is fully reported.
- Producing leases
- 589of 872 on record
- Operators
- 29
- Fields
- 25
- Top operator
- Sabine Energy Inc.
Own minerals in Upshur County?
A family member owned minerals here?
Search their name: a family member who owned minerals hereWhere it sits
This county
- Oil, last 12 months
- 266,094 bbl
- Share of Texas gas
- 0.2%
- Wells on record
- 982on leases with production reports
- Data through
- Jul 2026
Five years of output in Upshur County
Gas output in Upshur County rose 22% over the last 12 months
22M mcf through Jul 2026, against 18M mcf a year earlier. Peak Dec 2025: 2.2M mcf.
Oil output in Upshur County rose 30% over the last 12 months
266k bbl through Jul 2026, against 205k bbl a year earlier. Peak Dec 2025: 27.2k bbl.
SourceTexas Railroad Commission Production Data Query, county totals, through Jul 2026, file dated Oct 20, 2026.
Cite or embed this chart
Free to use for Upshur County, Texas, with a credit and a link. Copy what you need.
Credit line
Source: Royalty Clerk analysis of Texas Railroad Commission filings, https://royaltyclerk.com/texas/counties/upshur-county-tx, data to July 2026.
The chart on your own page
Free to embed on any site. Keep the “Source: Royalty Clerk” link under the chart.
See the code
<iframe
  src="https://royaltyclerk.com/embed/counties/upshur-county-tx"
  title="Royalty Clerk: oil and gas production, Upshur County, Texas"
  width="100%"
  height="400"
  style="border:0"
  loading="lazy"></iframe>
<p style="margin:4px 0 0;font-size:14px">Source: <a href="https://royaltyclerk.com/texas/counties/upshur-county-tx" target="_blank">Royalty Clerk</a></p>
<script>
window.addEventListener("message", function (e) {
  if (e.origin !== "https://royaltyclerk.com" || !e.data || e.data.type !== "rc-embed-height") return;
  var frames = document.getElementsByTagName("iframe");
  for (var i = 0; i < frames.length; i++) {
    if (frames[i].contentWindow === e.source && e.data.height > 0) frames[i].style.height = Number(e.data.height) + "px";
  }
});
</script>
Upshur County oil and gas production by year, 1993 to 2025
Every full year we hold, 1993 to 2025. The highest year for oil since 1993 was 1996, at 941,684 bbl. The highest year for gas was 1996, at 64,662,490 mcf.
| Year | Oilbbl | Gasmcf |
|---|---|---|
| 2025 | 226,078 | 19,516,212 |
| 2024 | 193,222 | 17,019,047 |
| 2023 | 211,447 | 18,189,871 |
| 2022 | 212,047 | 17,391,579 |
| 2021 | 221,520 | 18,419,052 |
| 2020 | 250,856 | 21,104,236 |
| 2019 | 289,587 | 22,246,829 |
| 2018 | 270,358 | 19,098,811 |
| 2017 | 268,056 | 19,381,369 |
| 2016 | 302,071 | 21,048,375 |
| 2015 | 372,472 | 23,948,193 |
| 2014 | 364,059 | 24,847,664 |
| 2013 | 374,804 | 26,481,552 |
| 2012 | 408,956 | 29,542,731 |
| 2011 | 562,847 | 32,893,420 |
| 2010 | 492,727 | 35,805,221 |
| 2009 | 542,770 | 40,187,824 |
| 2008 | 648,210 | 46,111,096 |
| 2007 | 632,562 | 48,278,314 |
| 2006 | 665,107 | 52,094,281 |
| 2005 | 665,588 | 53,886,484 |
| 2004 | 662,537 | 53,765,951 |
| 2003 | 655,207 | 56,428,970 |
| 2002 | 702,503 | 62,400,526 |
| 2001 | 725,489 | 59,639,281 |
| 2000 | 696,590 | 57,182,483 |
| 1999 | 680,155 | 55,714,549 |
| 1998 | 790,575 | 61,219,730 |
| 1997 | 920,796 | 63,644,848 |
| 1996 | 941,684 | 64,662,490 |
| 1995 | 776,847 | 49,619,214 |
| 1994 | 753,572 | 46,822,575 |
| 1993 | 753,176 | 44,583,077 |
SourceTexas Railroad Commission production records, added up by county and calendar year. Oil includes condensate; gas includes casinghead gas. The year in progress is left out until it is complete.
The biggest leases in Upshur County
Under each volume: change on the year before.
2,575,443mcf gasn/a
2,092,141mcf gasn/a
1,974,844mcf gasn/a
1,009,998mcf gasn/a
999,490mcf gasn/a
873,851mcf gas−52%
851,064mcf gas−57%
688,466mcf gas−37%
444,370mcf gas−26%
309,100mcf gas−21%
307,091mcf gas−20%
290,503mcf gas−22%
277,853mcf gas−11%
268,108mcf gas−26%
241,512mcf gas−5%
224,406mcf gas−8%
186,509mcf gas−7%
151,734mcf gas−7%
132,205mcf gas−14%
131,594mcf gas−5%
5,407bbl oil−3%
111,069mcf gas+11%
108,447mcf gas+38%
107,938mcf gas+5%
103,108mcf gas−1%
Showing 25 of 150 (the 150 largest of 589), ranked by output value.
SourceTexas Railroad Commission Production Data Query.
Who runs the leases, and what they produce
Operators in Upshur County, by gas
Sabine Energy leads
- Sabine Energy Inc.16 leases11Mmcf
- Faulconer Energy, LLC117 leases3.1Mmcf
- Tischer Energy, LLC1 lease2Mmcf
- Sulphur River Exploration, Inc.76 leases1.4Mmcf
- Diversified Production LLC148 leases1.2Mmcf
- Tanos Exploration IV, LLC3 leases1.1Mmcf
- McBee Operating Company, L.L.C.56 leases906kmcf
- Rose City Resources, LLC51 leases609kmcf
Fields in Upshur County, by gas
Gilmer (Cotton Valley Sands) leads
- Gilmer (Cotton Valley Sands)43 leases · District 06 · Field 3494330014Mmcf
- Gladewater (Haynesville)38 leases · District 06 · Field 351345002.2Mmcf
- Rosewood (Cotton Valley)137 leases · District 06 · Field 783305001.8Mmcf
- Gilmer(jurassic)112 leases · District 06 · Field 349437501.5Mmcf
- Glenwood (Cotton Valley)162 leases · District 06 · Field 354153001.4Mmcf
- Delrose (Haynesville)12 leases · District 06 · Field 24173300600kmcf
- Cedar Springs (Cot. Valley, Lo.)5 leases · District 06 · Field 16613175330kmcf
- Cherokee Trace (Jurassic)7 leases · District 06 · Field 17480666130kmcf
More operators here
Recent drilling permits in Upshur County
TUEL-BOGEL GU 2 (AW) #1H
new drill · horizontal · Tanos Exploration IV, LLC · Upshur County
Permit 0913802 · Mar 4, 2026
HILL LC-BREYER B (AW) #2H
new drill · horizontal · Sabine Energy Inc. · Upshur County
Permit 0912835 · Feb 23, 2026
HIGHGROUND #2H
new drill · horizontal · Tischer Energy, LLC · Upshur County
Permit 0908643 · Jun 23, 2025
HIGHGROUND #1H
new drill · horizontal · Tischer Energy, LLC · Upshur County
Permit 0908640 · Jun 20, 2025
BARBER-GUNN (AW) #1H
new drill · horizontal · Tanos Exploration IV, LLC · Upshur County
Permit 0908340 · Jun 13, 2025
HILL LC-BREYER A (AW) #1H
new drill · horizontal · Sabine Energy Inc. · Upshur County
Permit 0905724 · Mar 5, 2025