
Texas county · RRC district 7B
Nolan County, Texas oil and gas
- 597,933bbl oil in the last 12 months
- 222producing leases
- 1,482wells on the map
- 25drilling locations in two years
Oil wells and drilling locations in Nolan County
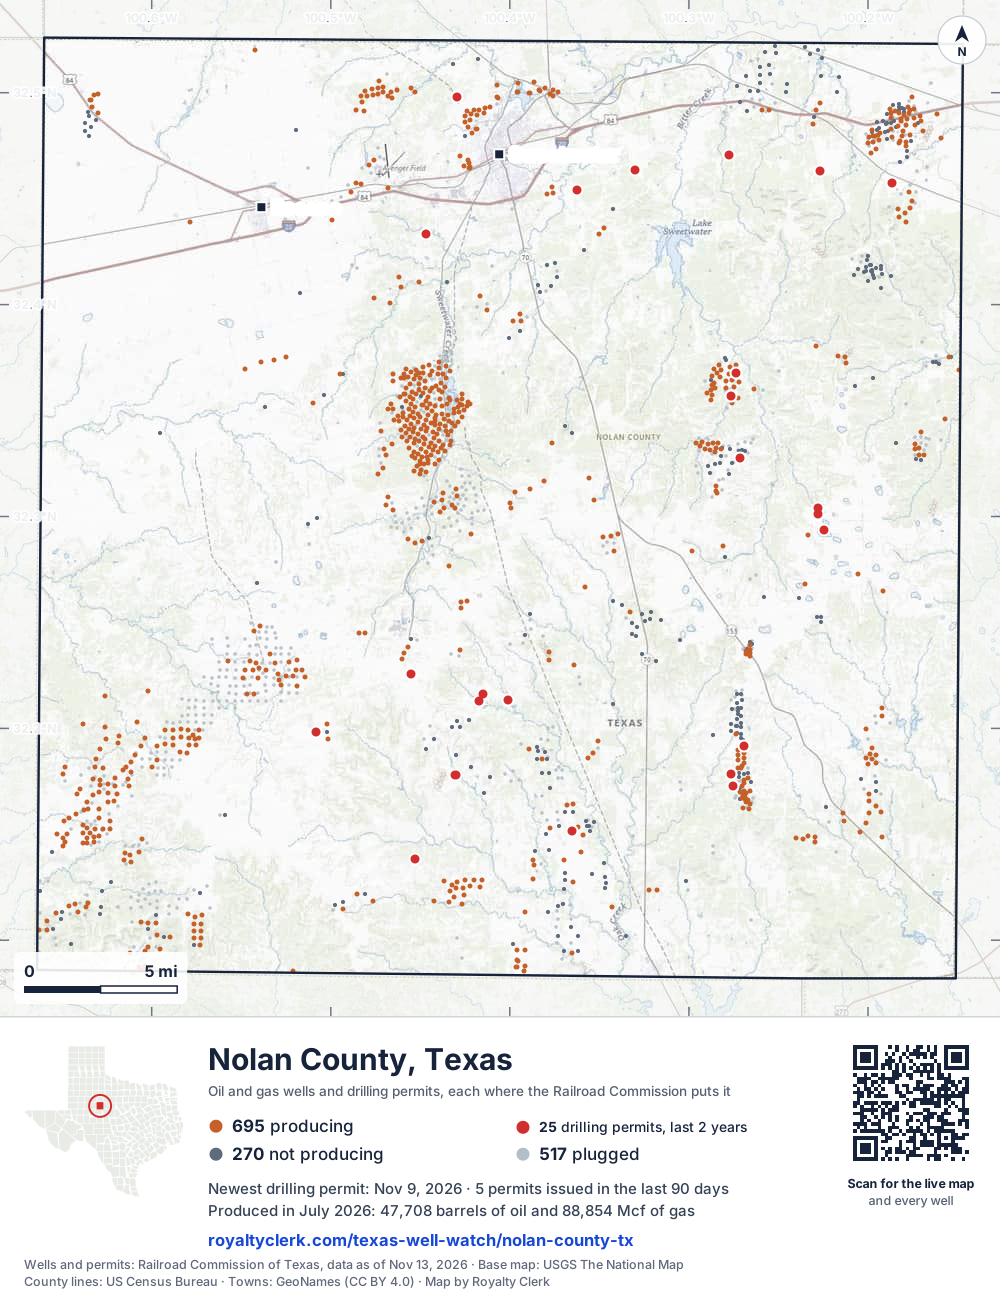
- Drilling locations25Permits issued in the last two years
- Producing wells695On a lease reporting production now
- Not producing270Shut in, inactive or no lease on record
- Plugged517The state's wellbore record says plugged
Sources: Railroad Commission of Texas well layers and permit files, US Census Bureau county outline, town points from GeoNames (CC BY 4.0), base map from USGS The National Map. A dot is a surface location; a horizontal well runs a mile or more from it.
1,482 wells with a location on the state's map (695 producing, 270 not producing, 517 plugged) and 25 drilling locations permitted in the last 24 months, each where the Railroad Commission puts it.
Use this map on your site
You may show this map on any site, unchanged. Keep the credit line and its link to Royalty Clerk under the map. The picture updates by itself as the state records new wells and permits.
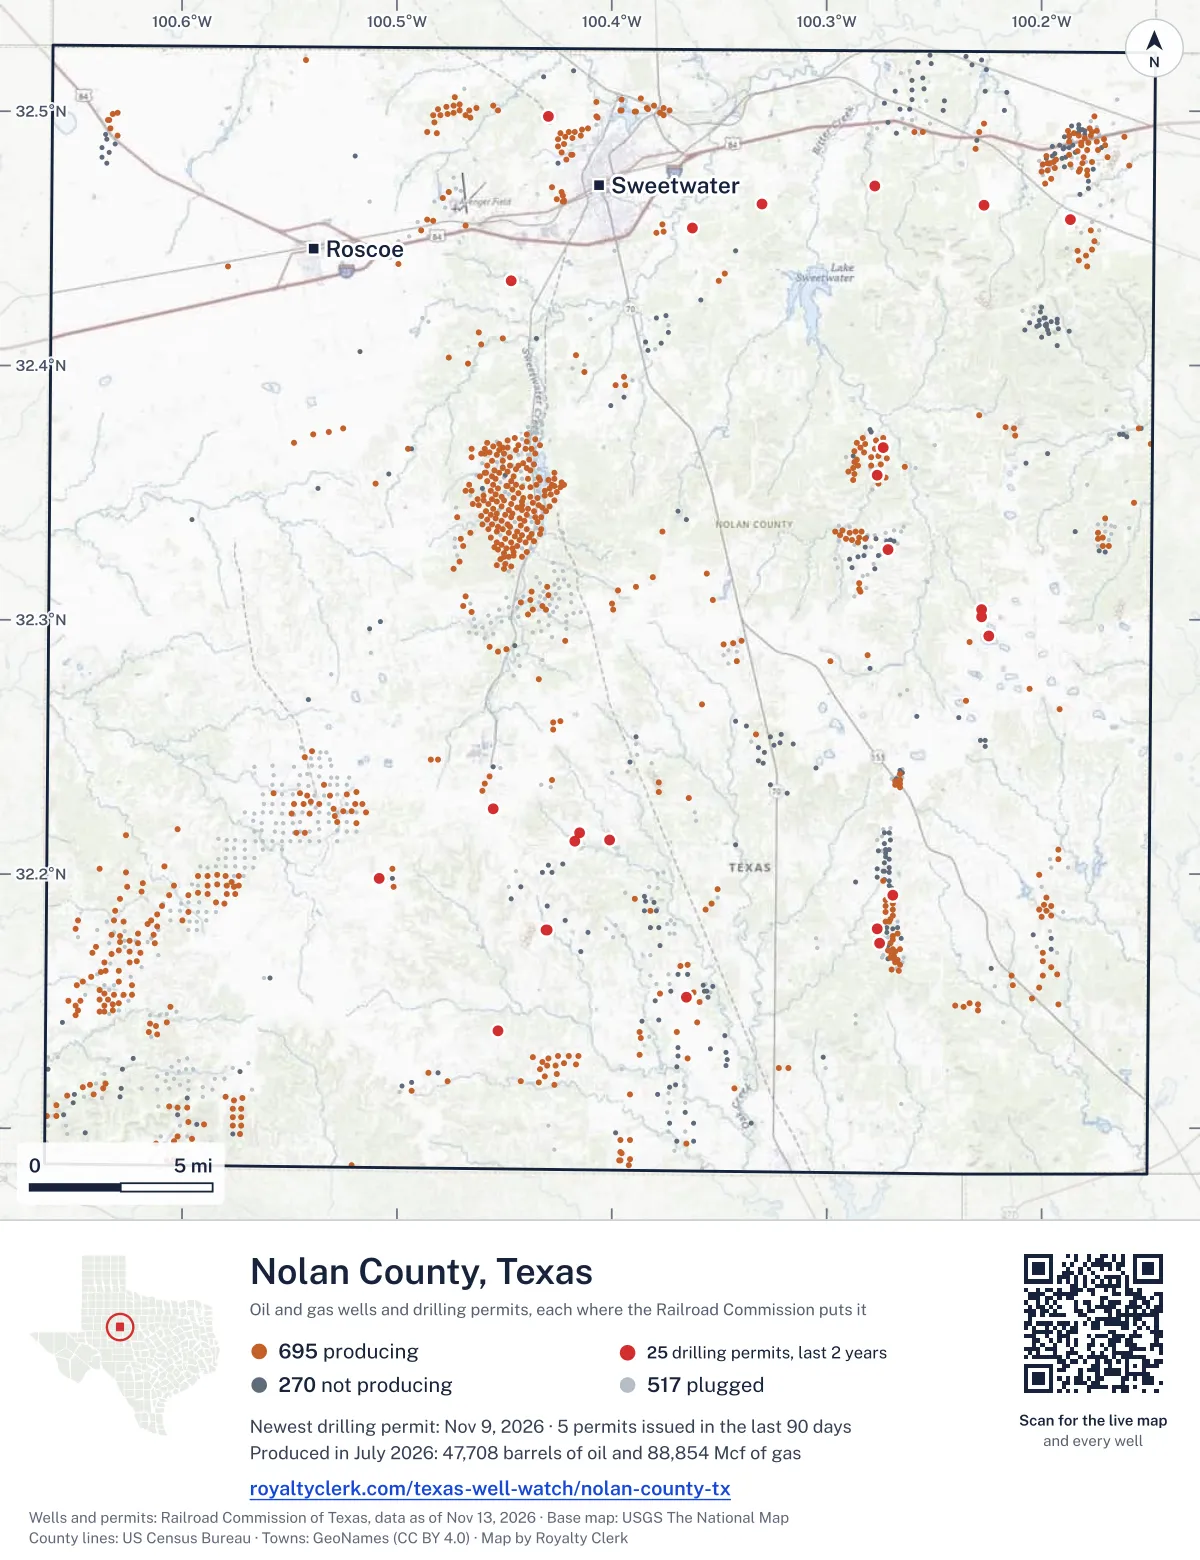
<a href="https://royaltyclerk.com/texas/counties/nolan-county-tx"><img src="https://royaltyclerk.com/maps/county-wells/nolan-county-tx.svg" alt="Map of Nolan County, Texas, with 1,482 oil and gas wells and 25 recent drilling locations as dots." width="1000" height="1300" loading="lazy" style="max-width:100%;height:auto;border:0"></a>
<p style="margin:4px 0 0;font-size:14px">Map: <a href="https://royaltyclerk.com/texas/counties/nolan-county-tx">Nolan County, Texas oil and gas wells</a> by Royalty Clerk, from Railroad Commission of Texas records</p>
Wells near a town: Roscoe · Sweetwater · Newest drilling permits in Nolan County · Wells by ZIP code
Nolan County reported 597,933 barrels of oil and 1 million mcf of gas in the last 12 months. That ranks 91st of 225 Texas counties by oil.
County dossier
August 2026 is still coming in. About 89% of Texas leases have reported it so far, so this page counts through July 2026 until it is fully reported.
- Producing leases
- 222of 496 on record
- Operators
- 50
- Fields
- 93
- Top operator
- Extex Operating Company
Own minerals in Nolan County?
A family member owned minerals here?
Search their name: a family member who owned minerals hereWhere it sits
This county
- Gas, last 12 months
- 1,009,788 mcf
- Share of Texas oil
- <0.1%
- Wells on record
- 1,490on leases with production reports
- Data through
- Jul 2026
Five years of output in Nolan County
Oil output in Nolan County fell 7% over the last 12 months
598k bbl through Jul 2026, against 644k bbl a year earlier. Peak Oct 2021: 116k bbl.
Gas output in Nolan County fell 18% over the last 12 months
1M mcf through Jul 2026, against 1.2M mcf a year earlier. Peak Dec 2021: 222k mcf.
SourceTexas Railroad Commission Production Data Query, county totals, through Jul 2026, file dated Oct 20, 2026.
Cite or embed this chart
Free to use for Nolan County, Texas, with a credit and a link. Copy what you need.
Credit line
Source: Royalty Clerk analysis of Texas Railroad Commission filings, https://royaltyclerk.com/texas/counties/nolan-county-tx, data to July 2026.
The chart on your own page
Free to embed on any site. Keep the “Source: Royalty Clerk” link under the chart.
See the code
<iframe
  src="https://royaltyclerk.com/embed/counties/nolan-county-tx"
  title="Royalty Clerk: oil and gas production, Nolan County, Texas"
  width="100%"
  height="400"
  style="border:0"
  loading="lazy"></iframe>
<p style="margin:4px 0 0;font-size:14px">Source: <a href="https://royaltyclerk.com/texas/counties/nolan-county-tx" target="_blank">Royalty Clerk</a></p>
<script>
window.addEventListener("message", function (e) {
  if (e.origin !== "https://royaltyclerk.com" || !e.data || e.data.type !== "rc-embed-height") return;
  var frames = document.getElementsByTagName("iframe");
  for (var i = 0; i < frames.length; i++) {
    if (frames[i].contentWindow === e.source && e.data.height > 0) frames[i].style.height = Number(e.data.height) + "px";
  }
});
</script>
Nolan County oil and gas production by year, 1993 to 2025
Every full year we hold, 1993 to 2025. The highest year for oil since 1993 was 1996, at 2,200,326 bbl. The highest year for gas was 1996, at 4,886,166 mcf.
| Year | Oilbbl | Gasmcf |
|---|---|---|
| 2025 | 613,415 | 1,041,515 |
| 2024 | 716,137 | 1,534,306 |
| 2023 | 923,787 | 1,833,660 |
| 2022 | 1,031,928 | 1,802,477 |
| 2021 | 1,052,531 | 1,906,653 |
| 2020 | 1,004,394 | 1,682,485 |
| 2019 | 1,134,117 | 1,957,993 |
| 2018 | 1,159,866 | 2,092,518 |
| 2017 | 1,423,799 | 2,523,725 |
| 2016 | 1,616,304 | 3,108,550 |
| 2015 | 1,794,212 | 3,452,514 |
| 2014 | 1,883,658 | 3,162,522 |
| 2013 | 1,802,160 | 3,290,172 |
| 2012 | 1,717,172 | 2,619,838 |
| 2011 | 1,534,124 | 2,459,612 |
| 2010 | 1,172,754 | 2,115,720 |
| 2009 | 1,148,198 | 2,244,665 |
| 2008 | 1,307,859 | 2,485,637 |
| 2007 | 1,166,465 | 2,111,194 |
| 2006 | 1,179,606 | 1,904,512 |
| 2005 | 1,315,387 | 2,043,785 |
| 2004 | 1,398,823 | 2,162,029 |
| 2003 | 1,500,495 | 2,352,464 |
| 2002 | 1,587,850 | 2,374,829 |
| 2001 | 1,921,163 | 2,671,680 |
| 2000 | 1,900,250 | 2,902,582 |
| 1999 | 1,602,376 | 2,829,719 |
| 1998 | 1,956,159 | 3,366,410 |
| 1997 | 2,159,733 | 4,288,330 |
| 1996 | 2,200,326 | 4,886,166 |
| 1995 | 2,053,212 | 4,490,215 |
| 1994 | 1,971,729 | 4,067,455 |
| 1993 | 1,928,019 | 4,364,907 |
SourceTexas Railroad Commission production records, added up by county and calendar year. Oil includes condensate; gas includes casinghead gas. The year in progress is left out until it is complete.
The biggest leases in Nolan County
Under each volume: change on the year before.
74,588bbl oil−7%
17,170bbl oiln/a
16,861bbl oil+146%
16,007bbl oiln/a
15,923bbl oil−32%
12,743bbl oil+3%
12,299bbl oil−40%
11,196bbl oil−51%
11,151bbl oil+4%
11,043bbl oil−9%
10,228bbl oil−66%
9,950bbl oil−10%
8,318bbl oil+184%
8,073bbl oil−26%
8,068bbl oil−12%
7,632bbl oil−14%
7,342bbl oil−11%
7,164bbl oil+10%
7,112bbl oil−16%
6,791bbl oil−19%
6,628bbl oil+9%
6,601bbl oil−18%
6,484bbl oil−6%
6,179bbl oil+160%
5,721bbl oil+12%
Showing 25 of 150 (the 150 largest of 222), ranked by output value.
SourceTexas Railroad Commission Production Data Query.
Who runs the leases, and what they produce
Operators in Nolan County, by oil
Extex Operating leads
- Extex Operating Company25 leases94.6kbbl
- Scout Energy Management LLC30 leases81.1kbbl
- Grayrock Energy II, LLC5 leases80.6kbbl
- Goodrock Natural Resources, LLC20 leases44.5kbbl
- Clear Fork, Incorporated14 leases40.4kbbl
- Daylight Petroleum LLC9 leases34.9kbbl
- Citation Oil & Gas Corp.5 leases28.3kbbl
- Gungoll, Carl E. Exploration LLC5 leases19.5kbbl
Fields in Nolan County, by oil
Lake Trammel, W. (Canyon) leads
- Lake Trammel, W. (Canyon)2 leases · District 7B · Field 5159533374.9kbbl
- Garden City, S. (Wolfcamp)8 leases · District 08 · Field 3399850048.1kbbl
- JMM (Ellenburger)5 leases · District 7B · Field 4511060032kbbl
- White Flat16 leases · District 7B · Field 9690700130.1kbbl
- Nena Lucia (Strawn Reef)9 leases · District 7B · Field 6494666429kbbl
- Sweetwater (Canyon Sand)22 leases · District 7B · Field 8761350023.4kbbl
- Hardrock (King Sand)4 leases · District 7B · Field 3900233322.9kbbl
- Auld (Cisco Sand)6 leases · District 7B · Field 0437750020.2kbbl
More operators here
Recent drilling permits in Nolan County
BRIDGFORD 102 #1
recompletion · Per Operating LLC · Nolan County
Permit 0919636 · Nov 9, 2026
BRIDGFORD 102 #2H
new drill · horizontal · Per Operating LLC · Nolan County
Permit 0919901 · Nov 6, 2026
EAGLE CREEK #1
recompletion · horizontal · Per Operating LLC · Nolan County
Permit 0919638 · Nov 4, 2026
BIG EIGHT #1
new drill · Walter Exploration Company · Nolan County
Permit 0919437 · Oct 21, 2026
THOMAS RANCH #1H
recompletion · horizontal · Per Operating LLC · Nolan County
Permit 0919143 · Oct 12, 2026
HANKS, BILLIE 'C' #2
new drill · Goodrock Natural Resources, LLC · Nolan County
Permit 0917615 · Aug 7, 2026